Hello traders, sorry for the delay, I was busy with the Premium webinar.
What a day it was yesterday. The market surprised a few people and confused many more, as it often does. Looking at the daily chart makes for some very grim reading if you are a bull. Because not only did we print a doji inside the reversal zone (on the median line/centre line), but we followed it with a week’s worth of heavy selling pressure. So the question is whether or not this will now go on to complete the move at the reaction line. The momentum is strong at the moment, so congratulations to the bears in the group.

So the major swings are bearish, after collapsing through the 12280 barrier, how about the minor swings? Need we ask?
They are clearly bearish as well. Notice how price creates mini retracement-press-lines (or trend lines), then breaks them and kisses them goodbye?
I wonder if that presents an opportunity for this most recent one. That would be an aggressive short, considering that if we zoom out and look left, we are in another major zone which could support price.

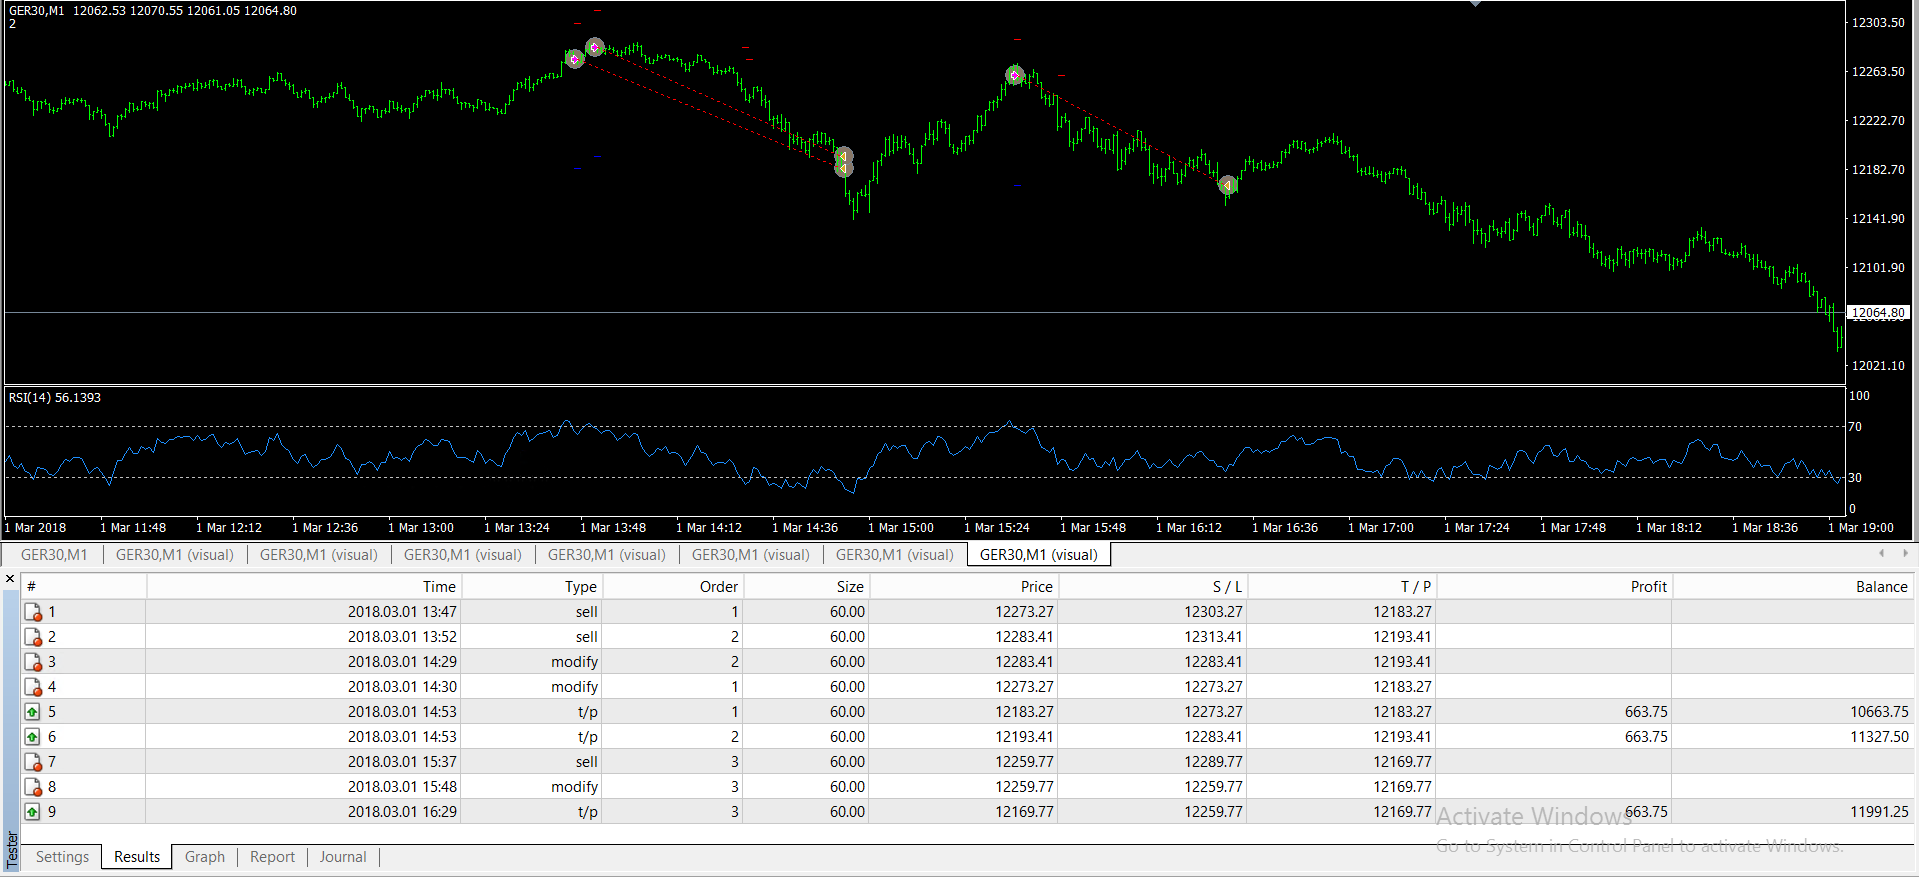
02-03-2018 Dax Algo Update
The webinar this morning completed some amendments to our algo, which should be great. Each week we add a new piece of functionality to the algo and I am sharing the code in the forum as well.
If we review its performance yesterday, it would have offered three trades, all sells.
Each trade would have provided 4.4 to 1 reward and each trade hit target, so it would have added over 13% to the account (if you use the full 1% of the account per trade). Very good performance.
The algo is currently only available to premium members. To find out more about premium membership click here
Dax Automated Trading
02-03-2018 Dax Key Levels
Regarding shorts, watch out for potential support between the 11850-11910 zone, as these were previous mini lows historically and two major lows we recently in this zone as well. Below that, we have the 11700-11750 zone. For longs, be cautious, considering the momentum, but sellers showed up around 11965, 12000 and 12080, so these could be potential short-term targets for bounces.
The 50 daily EMA is still above the 200, so this just demonstrates how lagging indicators can provide difficulties in finding trading opportunities. This will likely take a few days to catch up. The ATR is reducing back to normal levels after the previously high volatility.
If we manage a significant bounce, then the POC from yesterday could be interesting but it would have to be a sustained bounce.
| KEY LEVELS | |
| POC * | 12254 |
| Value Area High * | 12293 |
| Value Area Low * | 12058 |
| 14 Day ATR | 197.14 |
| 200 EMA | 12633 |
| 50 EMA | 12745 |
| Daily R2 | 12551 |
| Daily R1 | 12309 |
| Daily Pivot | 12160 |
| Daily S1 | 11917 |
| Daily S2 | 11769 |
| *These are FXCM numbers, not futures numbers. Please be aware that FXCM can often be 5-10 points higher than futures prices | |


