Good morning traders. We have all sorts of rumours coming from the US v China tariff saga, with reports suggesting that there will be a 90-day pause on tariffs to allow talks. This would provide some respite for the recent uncertainty hitting sentiment, so I will be keeping an eye on that. We’ll get to the technicals later.
What Next For DAX30?
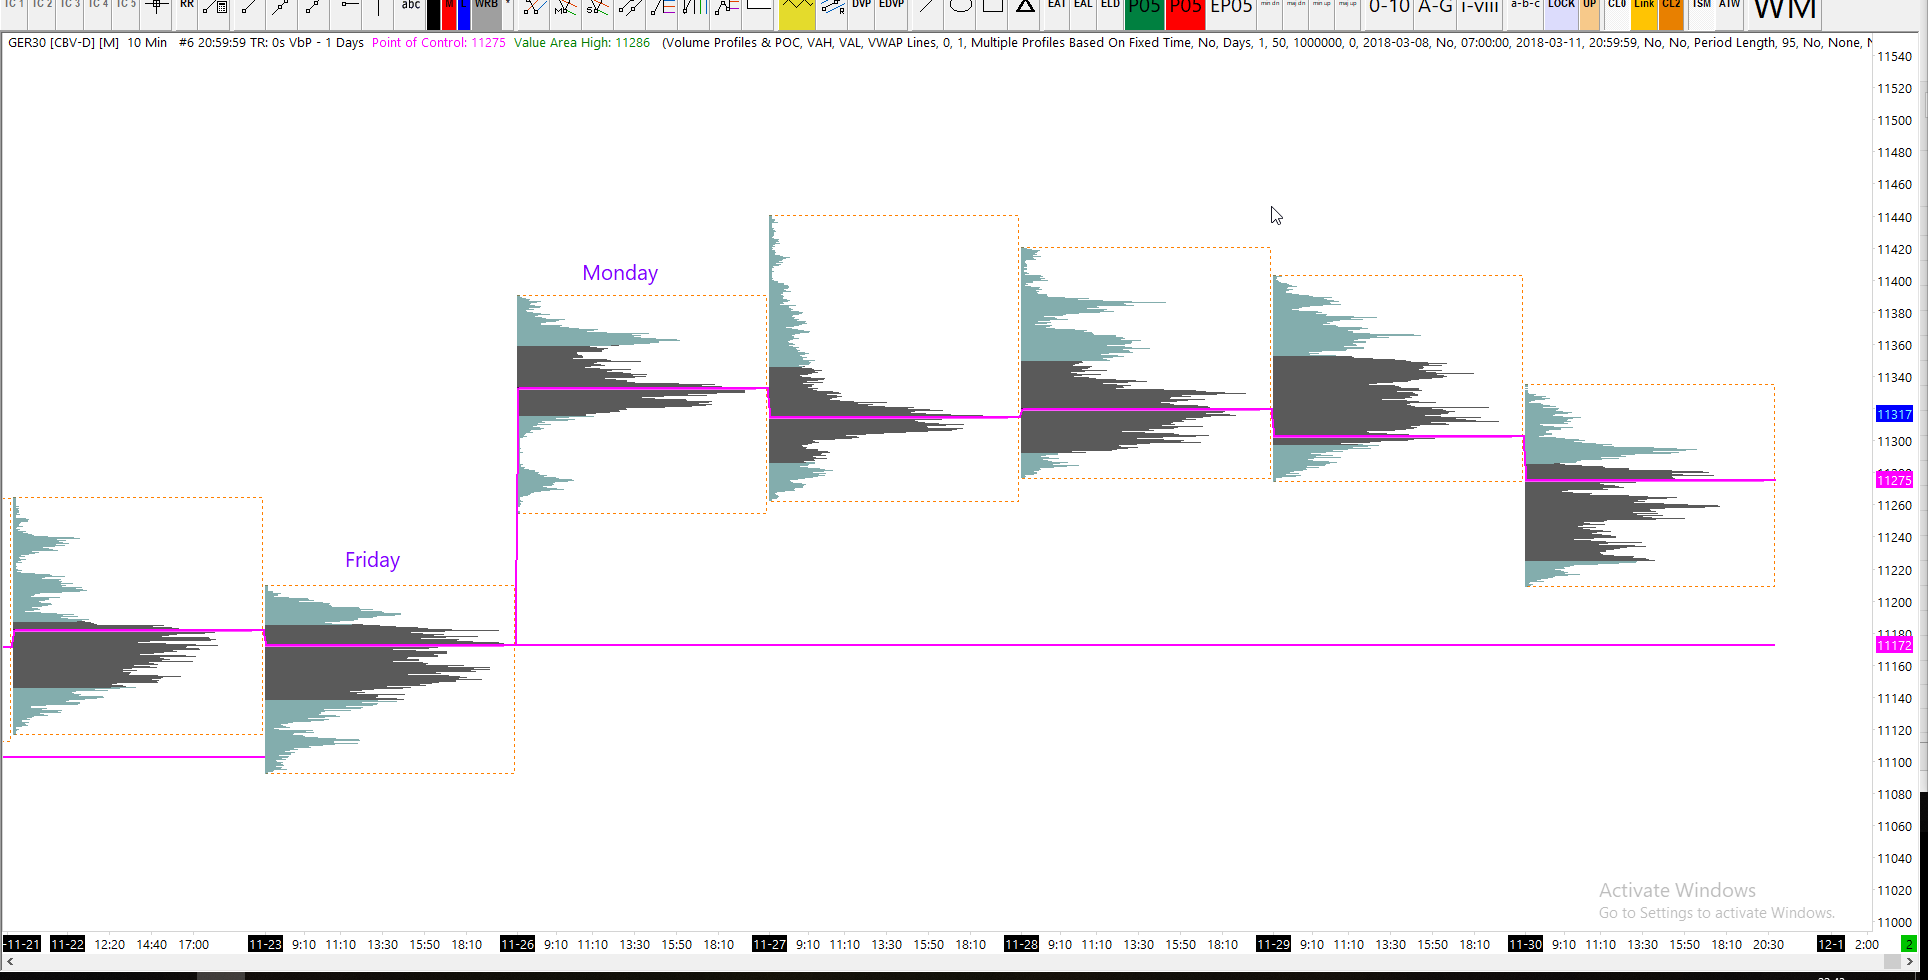
In the article on Friday, I discussed that shorts would be popular, as the month comes to an end and we definitely saw the selling pressure in the early part of the session, however the bounce in the second half completed a resilient recovery. Now December is here, perhaps we can see the seasonally expected santa rally starting over the next week of trading. Looking on the daily chart below, you would have to agree that the most recent major bearish swing would certainly allow for some retracement, especially after the major double bottom. We even see bullish divergence forming there (bullish RSI divergence).
So I am watching for a break above the black downsloping high-to-high trend line on the daily chart

Early Clues To Watch For Direction
The easiest way to fid the early clues, is to strip the charts back to basics and watch the mini median lines, or perhaps the median lines on a lower time frame, such as the hourly.
For example below, notice how price failed to tag the 6ML7-8 and instead we’re now looking at 7ML8-9 (click here to get the swing trading bible to decipher these codes). If price holds the 9MLH, or the lower median line parallel from the fork, it’s a bullish sign. And if we take out and expand through the median line, we stand a good chance of testing and breaking the recent highs, which will continue the string of higher highs and higher lower lows in the short-term.

Intraday DAX Trading
On Friday I only took two trades and then quit for the day.
I rarely trade Friday afternoon anyway, plus I was busy giving members access to my intraday strategy for Sierra Charts. If you’re interested in learning more about that, click here: https://thedaxtrader.co.uk/dax-trading-strategy/
See more from the trading diary here: https://thedaxtrader.co.uk/week-48-intra-day-trading-results-2018/
Results
|
30th November |
|
| Trades | 2 |
| Start | 13883 |
| Final | 14514 |
| Result | 631 |
| Gain | 4.55% |
Trades
| # | Date | Mkt | Type | Entry | SL | TP | RvR | % | Close | Pips | Return | Balance |
| 142 | 30-Nov | DOW | S | 25349.3 | 25362 | 25297 | 4.12 | 4.12% | 25321.1 | 28.2 | 2.22% | 14,192 |
| 143 | 29-Nov | FTSE | S | 7029.1 | 7037 | 6997 | 4.06 | 4.06% | 7011.15 | 17.95 | 2.27% | 14,514 |
Key Levels
| DAX | FTSE | DOW | ESTOXX | |
| Point of Control : | 11259 | 6996 | 25310 | 3178 |
| Value Area High : | 11281 | 7003 | 25374 | 3182 |
| Value Area Low : | 11220 | 6984 | 25284 | 3165 |
| VWAP : | 11263 | 6996 | 25351 | 3172 |
| R2 : | 11413 | 7090 | 25835 | 3204 |
| S2 : | 11161 | 6919 | 25088 | 3148 |
| Pivot : | 11287 | 7004 | 25461 | 3176 |
| Camarilla Breakout (Bull) | 11387 | 7057 | 25787 | 3200 |
| Camarilla Breakout (Bear) | 11248 | 6962 | 25377 | 3169 |
Economic Calendar

Useful Links & Resources
SIGNALS RESULTS
https://thedaxtrader.co.uk/daxtrader-signals-results/
ECONOMIC CALENDAR
https://thedaxtrader.co.uk/economic-calendar/
DAX-RELATED NEWS
https://thedaxtrader.co.uk/dax-news-feed/
LIVE DAX CHART
https://thedaxtrader.co.uk/dax-chart-interactive/
POSITION SIZE CALCULATOR
https://thedaxtrader.co.uk/calculator.html
TELEGRAM CHANNEL: More Analysis
https://t.me/DaxTraderChannel


