Welcome to the DAX 30 Index Outlook traders, I hope you all had a nice weekend. Let’s get straight into the charts to try and digest things a little bit. The DAX kicks off with a pretty bullish start, it’s drawing in the counter-trend traders with some attractive shorting opportunities, but at the moment it is not ready to turn.
We believe that the fast price action this morning has left behind a void that will likely be filled at some point either today or tomorrow.
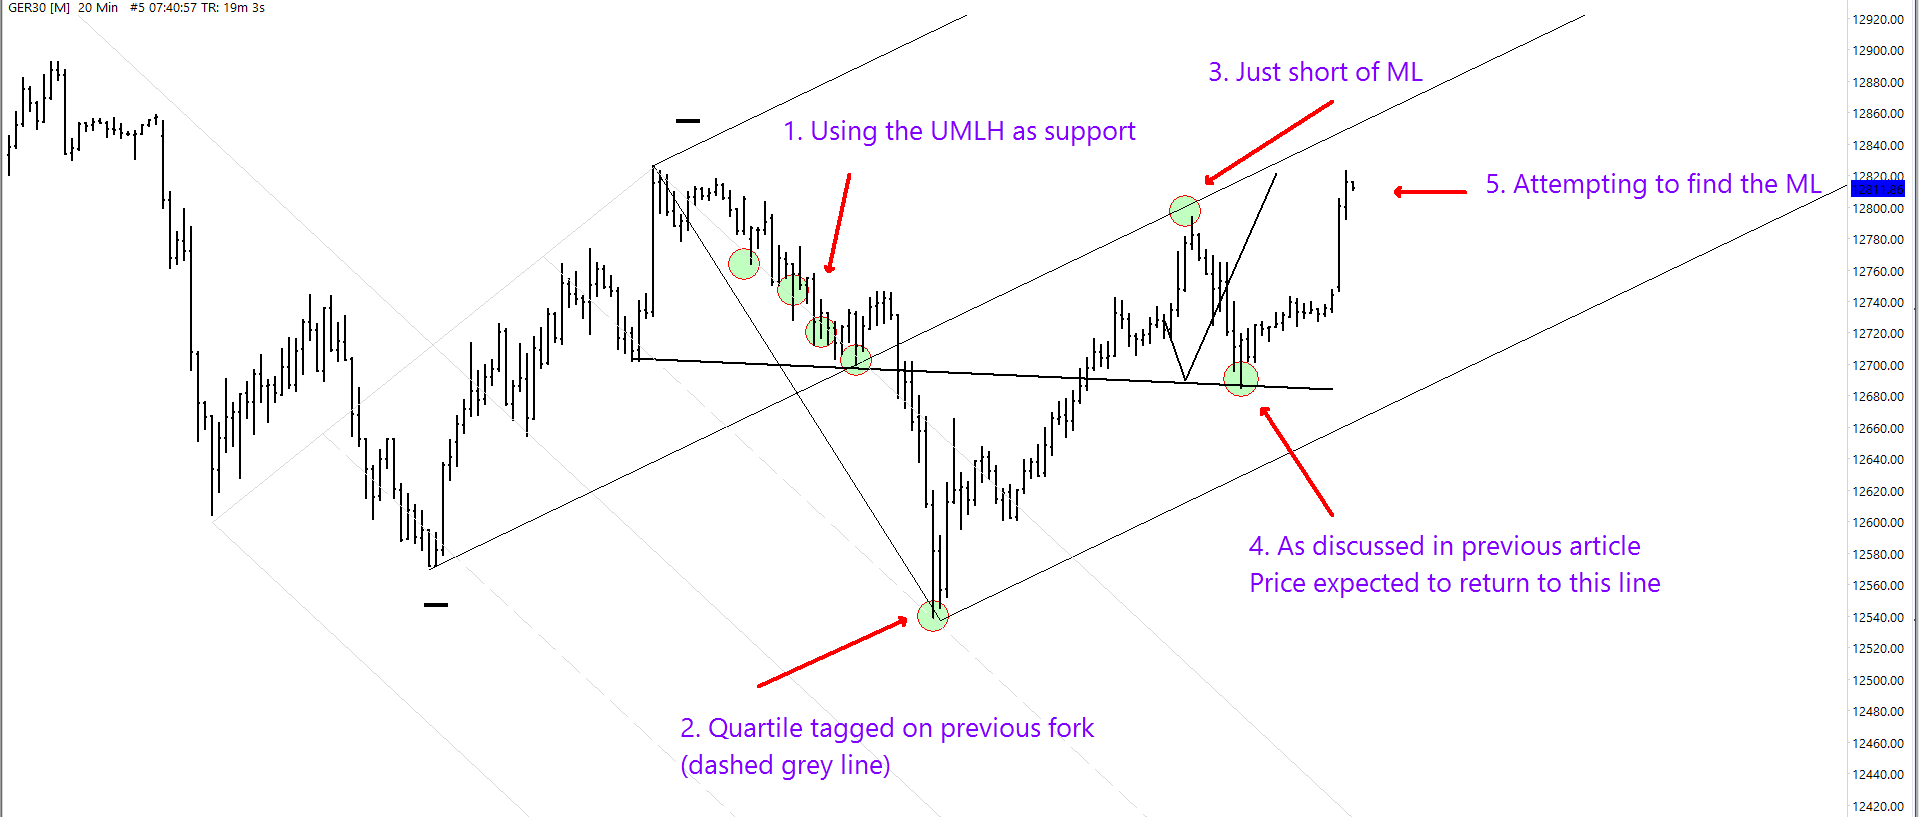
The 20-minute chart is quite busy so I’ve numbered the areas that I want to talk about.
DAX 30 Index Outlook – 20-Minute Chart
So first of all, you can see a series of tests on the grey UMLH. This often happens when price breaks out the top of a fork. It uses the previous parallel as support. Next, I find it interesting how we then see an action point (in this case it is a fast move in price) which broke through the UMLH and washed that zone, reaching as far as the quartile. The quartile line provided the perfect springboard.
This bounce from the quartile line, and the price action around it, has formed a pivot. In our case it is a major pivot and that allows us to draw a new fork. Notice how price almost reached the median line on the first attempt?
I remember commenting on a retracement back to the black line, noted as number four. So I was pleased to see that. Now, this morning we have a bullish start to the day and price seems to want to now reach that ML.
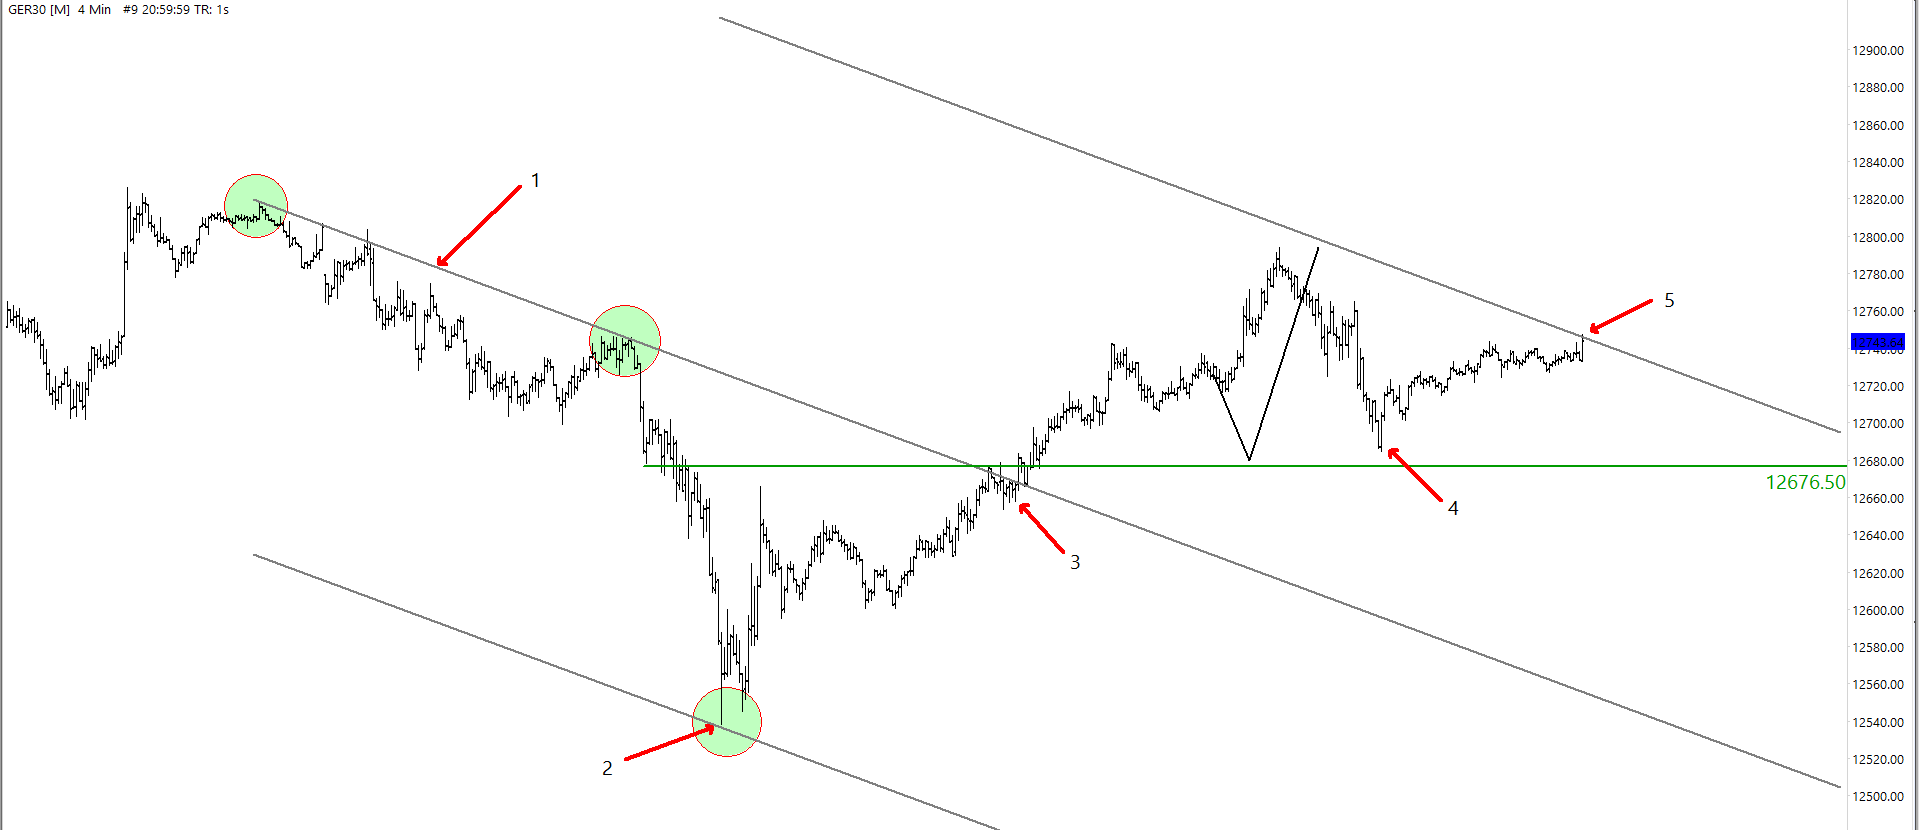
DAX 30 Index Outlook – 4-Minute Chart
The four-minute chart is also interesting. The first label is the centreline of this ACR line set. To draw this type of centreline you start with a multi-pivot line. You don’t need to find a point where price action accelerated, such as label two. And according to Newton’s third law of motion, for every action there is an opposite and equal reaction, we expected the price to reach the other side of the centre line. We can see a balance point at label three and then the expected pull back at label four. Now, this morning we have broken through the top of the reaction line.
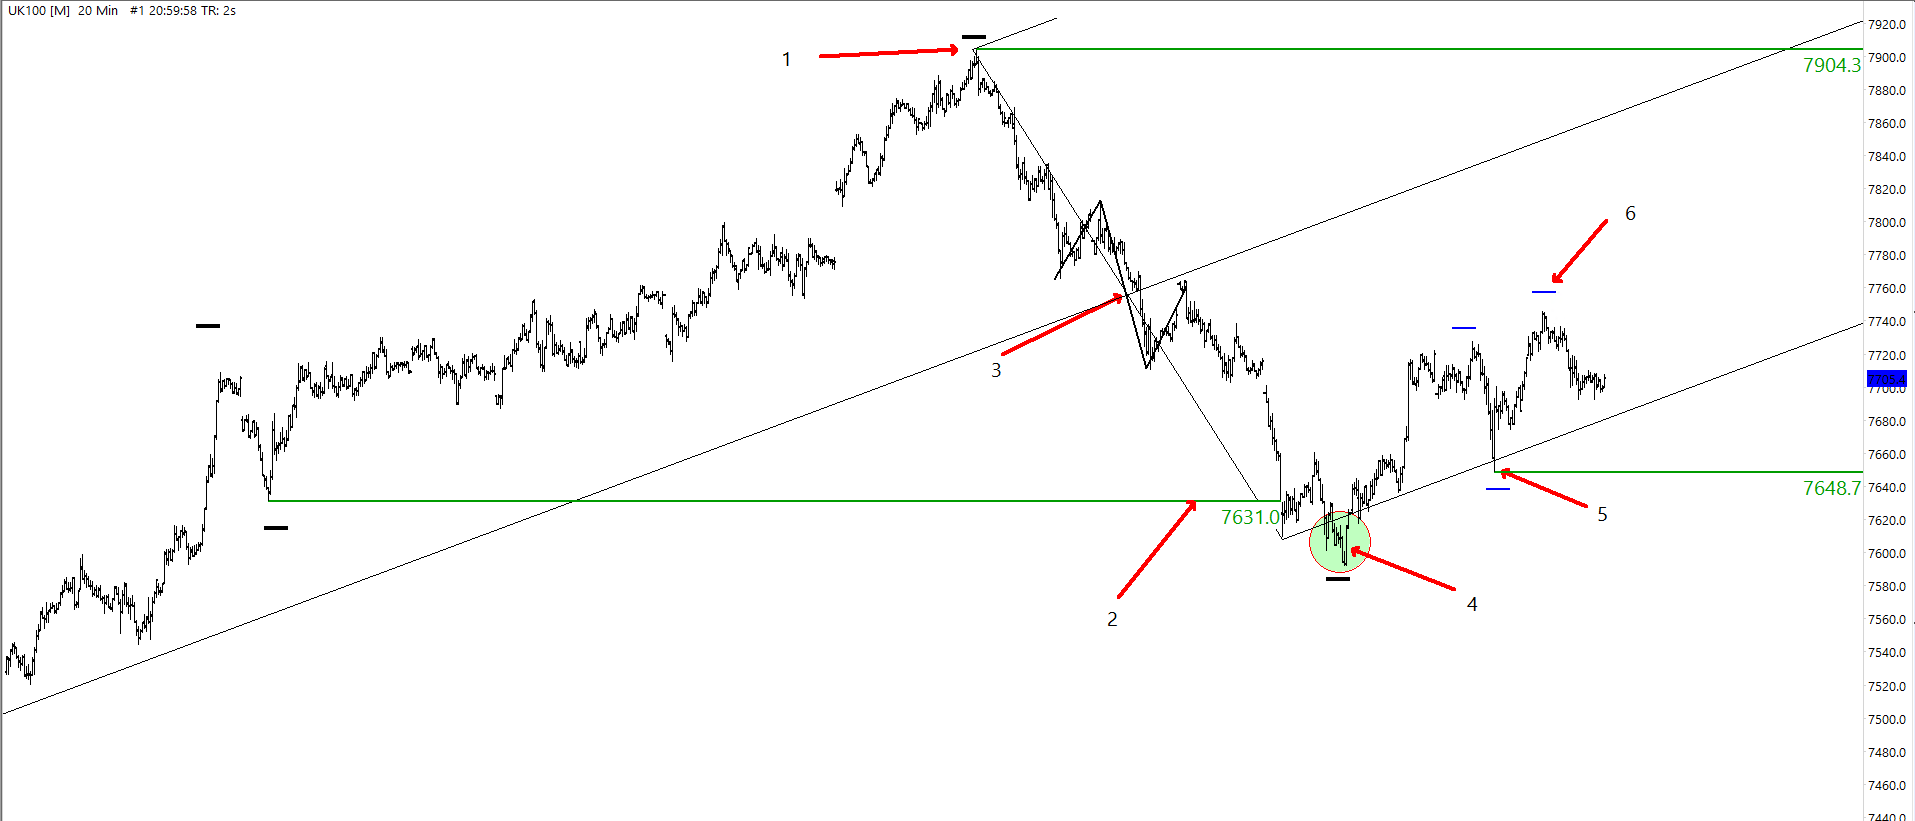
04-06-2018 FTSE100 Analysis
The FTSE seems to now have completed it bearish major reaction leg and continues its ascent once more. The minor swings are bullish above 7648 however technically the market remains bearish overall below 7904.
We have drawn a fork on the chart and so far price has peeled away from the LMLH. Does this suggest a move towards the ML?
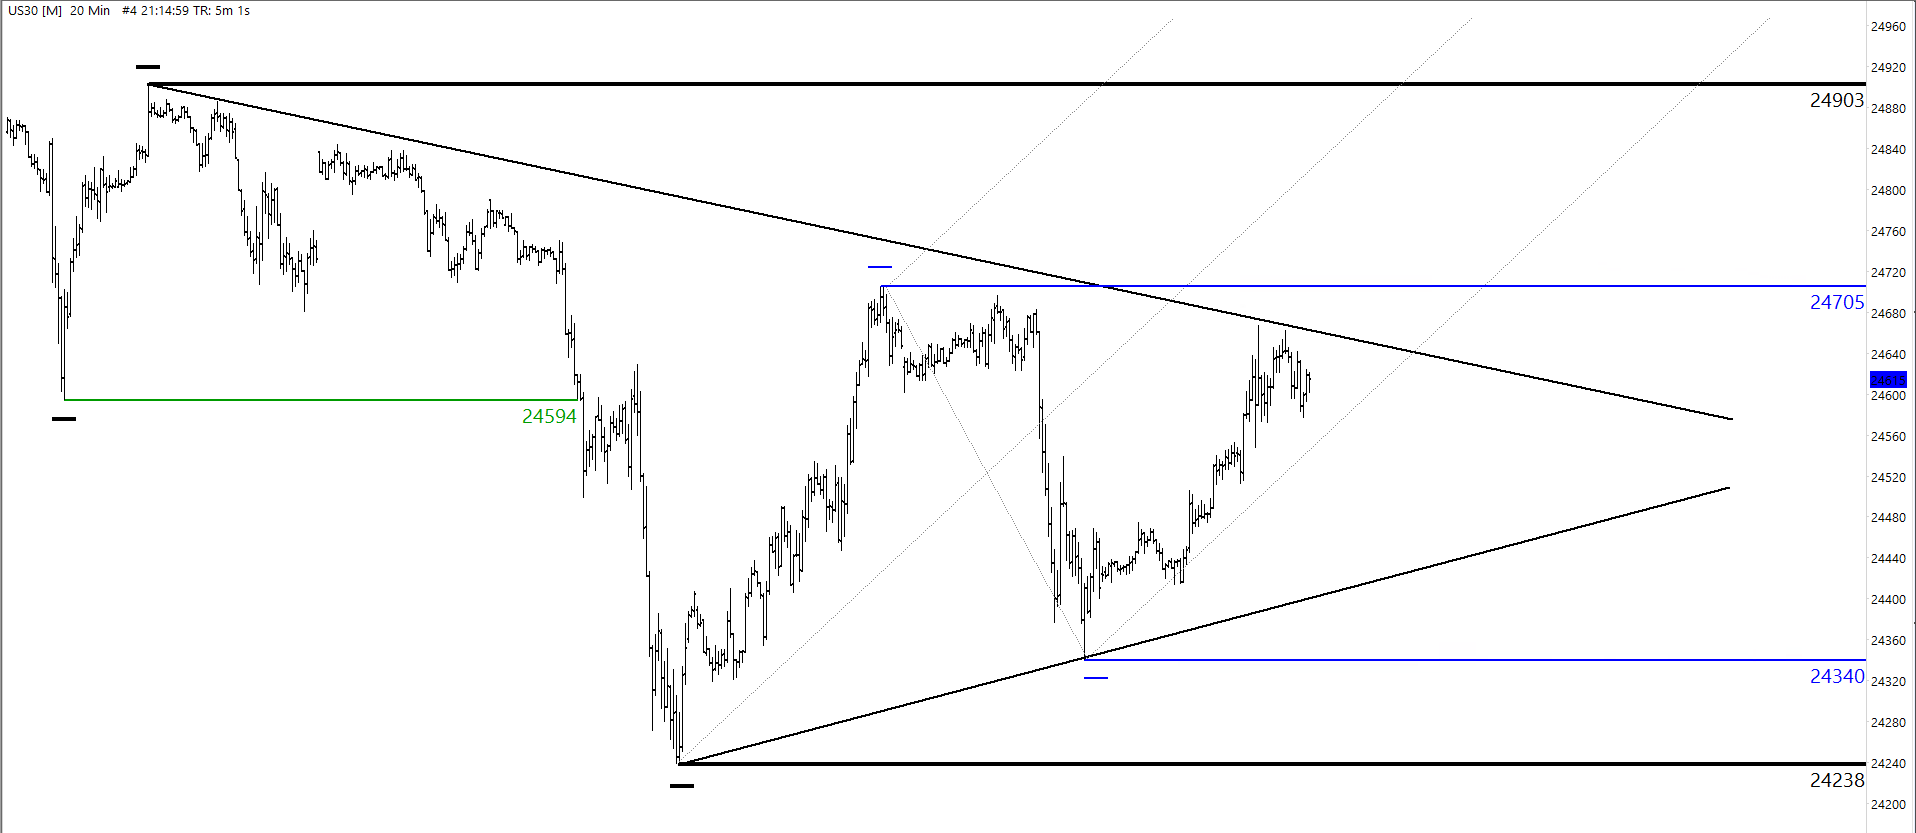
04-06-2018 DOW Analysis
The horizontal black lines represent the major swings and the horizontal blue lines represent the minor swings. The chart shows a coil and a grey fork. Price has now broken above the coil and tested the top of the coil and is about to test the 24 705 minor swing high. Price action remains inside the grey fork and is yet to meet the median line. So that would be an obvious target, but it does mean testing the major swing high. But the Americans are not really known for their selling.
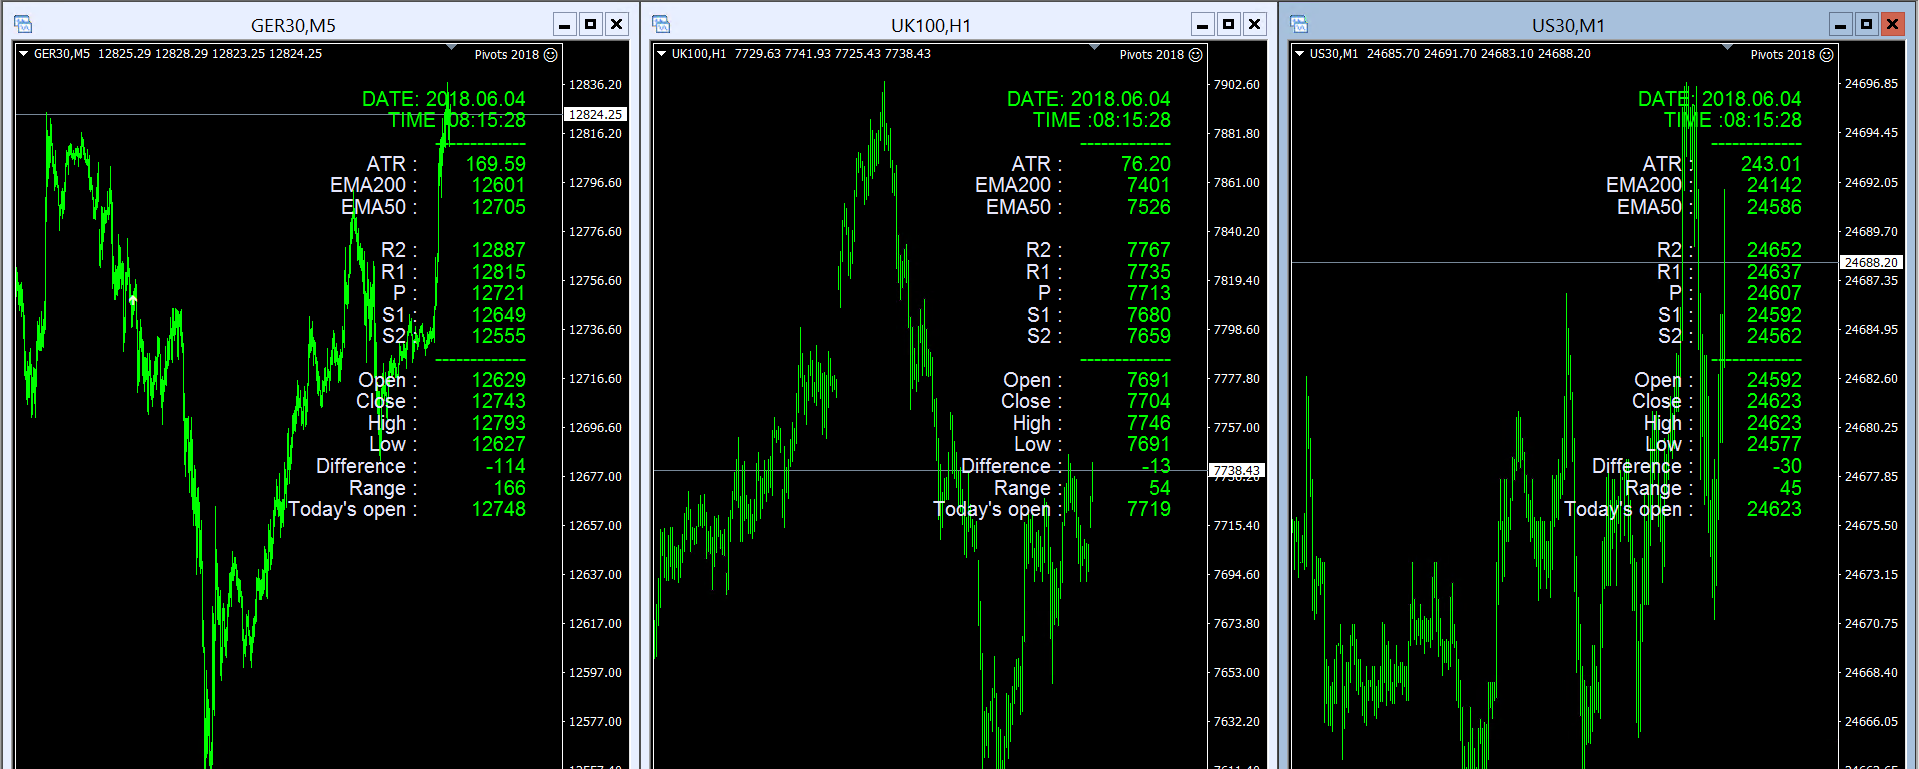
04-06-2018 DAX 30 Index Outlook – Key Levels
Develop Your Trading Business
TheDaxTrader.co.uk provides top quality DAX Analysis articles every day cover various topics of technical analysis from technical indicators to naked price action. We study market geometry and share our outlooks. If you want to learn more about how we trade, you can become a member today and get access to our DAX trading strategy. We trade the strategy every day and this is where we generate our DAX signals. So come and learn the strategy for yourself.
Perhaps you want to learn how to become a signal provider for yourself? If so, learn about how to send trading signals from Metatrader 4 to Telegram. We have produced an excellent piece of software will help you do exactly that. To learn more about the DAX, visit the Wikipedia page, you will find we are mentioned there.


