Good morning traders and welcome to the GER 30 Index Analysis. Yesterday we saw a range of 93 points but the DAX30 closed 43 points lower at 12,991 (according to CFD prices from FXCM). This morning we gapped to 12,999 finding a high of 13,008, but it’s still very early. The daily candle from yesterday formed a lower high and a lower low than both Monday and Friday, suggesting the start of a new bearish trend.
Does this mean that we are reversing?
Not necessarily, no. To decide this, we need to establish the trend-defining level. In my opinion, that is still 12850 and we remain bullish above that. (The normal trading disclaimer and warnings – at the bottom of the site – apply to any content on this site)
16-05-2018 GER 30 Index Analysis
If we take a look at the profiles below, we can see that yesterday we took out another POC. This highlighted by the higher of the two red lines. The red lines are pointing at the naked POCs from last week.
We can also see a double distribution day on the profile from yesterday. Notice how the low-volume area in the middle of the two distributions straddles the POC from Monday. Also, notice how Price has found support just above that low volume zone. I would like to see whether price slices through that zone or holds it.

The 250 tick chart below shows an ACR line set. I shared this idea yesterday on the premium channel.
This is a strategy that is very effective on the Dax30.
Trader development members can visit the new course to find out more about ACR line sets.

Notice in the chart below how price responded to the zone. When price action responds like this, it builds great confidence in the tools that we use.
GER 30 Index Analysis
Having an understanding of the way price moves can greatly improve our performance as a trader.

I find this next chart interesting because of the way price is responding to the fork.
This chart shows a regular pitchfork. Once the price responds from the third pivot (pivot C), it uses the LMLH as a platform to bounce. From the LMLH price shoots straight up to the ML. Once the price reaches the ML, it reverses.
This is textbook Dr Alan Andrews theory.

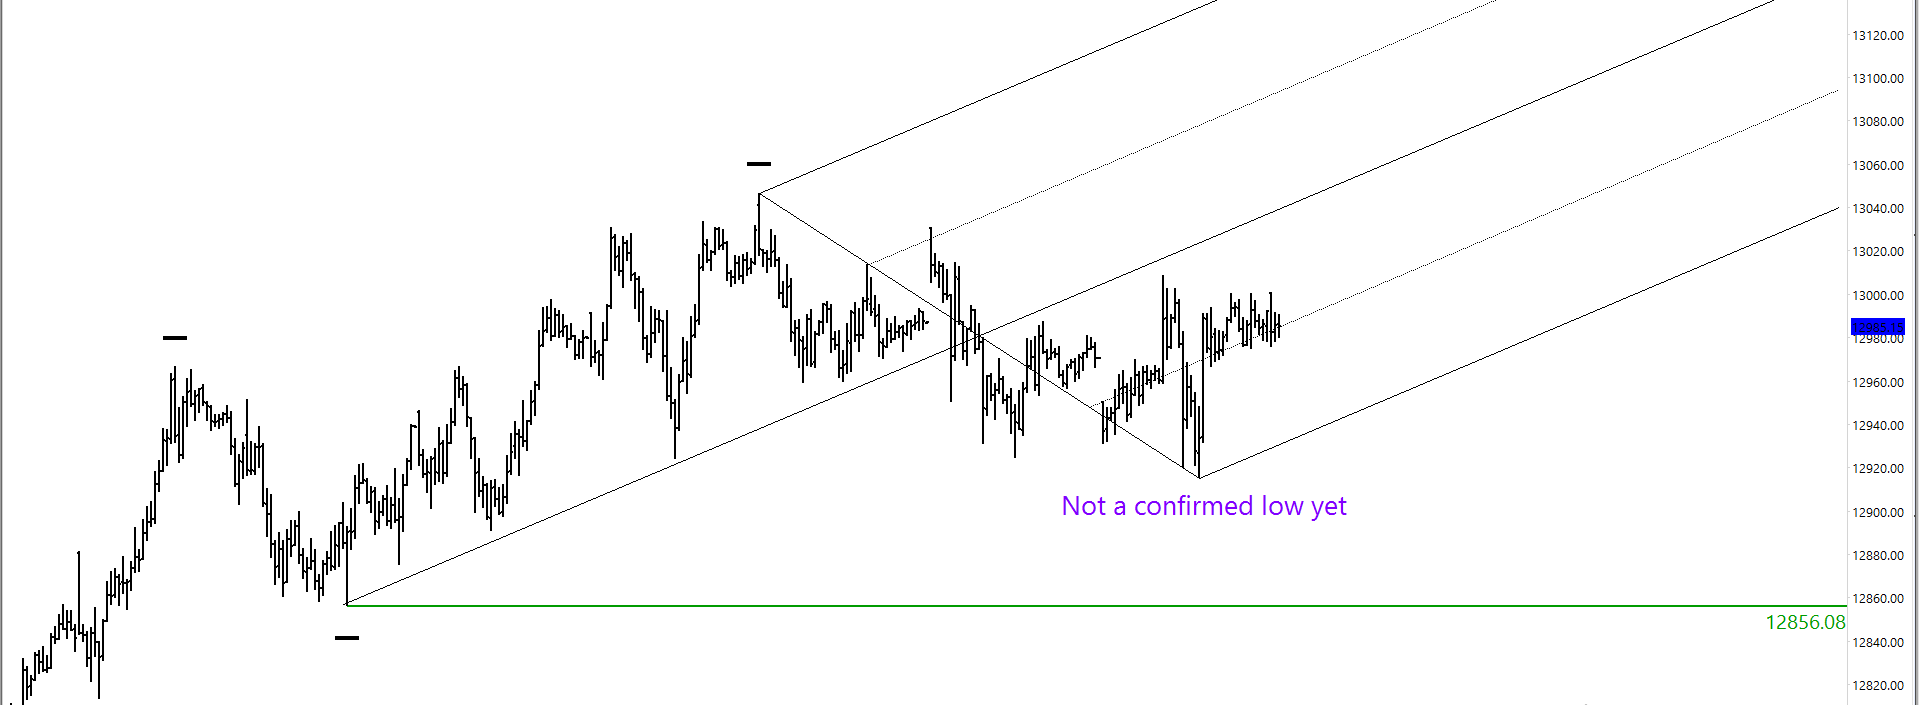
Finally, this chart is the 20-minute chart and the black swing markers show the current major swings.
The way I see things: The market is bullish above 12,850.
If this recent low holds, then we have a potentially interesting new major fork. I will continue to watch how this develops.

Develop Your Trading Business
TheDaxTrader.co.uk provides top quality DAX Analysis articles every day cover various topics of technical analysis from technical indicators to naked price action. We study market geometry and share our outlooks. If you want to learn more about how we trade, you can become a member today and get access to our DAX trading strategy. We trade the strategy every day and this is where we generate our DAX signals. So come and learn the strategy for yourself.
Perhaps you want to learn how to become a signal provider for yourself? If so, learn about how to send signals from Metatrader 4 to Telegram. We have produced an excellent piece of software will help you do exactly that. To learn more about the DAX, visit the Wikipedia page, you will find we are mentioned there.


