Hello traders. Just a quick one today, because I had a couple of web-hosting issues this morning which delayed my ability to do this article. So this one will just be the charts and key levels and the regular analysis will return on Monday. As it’s Black Friday, perhaps there is a bias towards the upside for the cash markets, given the increase in expected retail sales figures. But, I will probably take that with a pinch of salt today.
Useful Links & Resources
SIGNALS RESULTS
https://thedaxtrader.co.uk/daxtrader-signals-results/
ECONOMIC CALENDAR
https://thedaxtrader.co.uk/economic-calendar/
DAX-RELATED NEWS
https://thedaxtrader.co.uk/dax-news-feed/
LIVE DAX CHART
https://thedaxtrader.co.uk/dax-chart-interactive/
POSITION SIZE CALCULATOR
https://thedaxtrader.co.uk/calculator.html
TELEGRAM CHANNEL: More Analysis
https://t.me/DaxTraderChannel
Daily Chart
Double bottom limiting the downside. Overhead press (downsloping high-to-high trendline) limiting the upside.

Hourly Chart
Trend defining levels 11418 and 11009
Bearish below 418.
Break below 11009 to continue trend

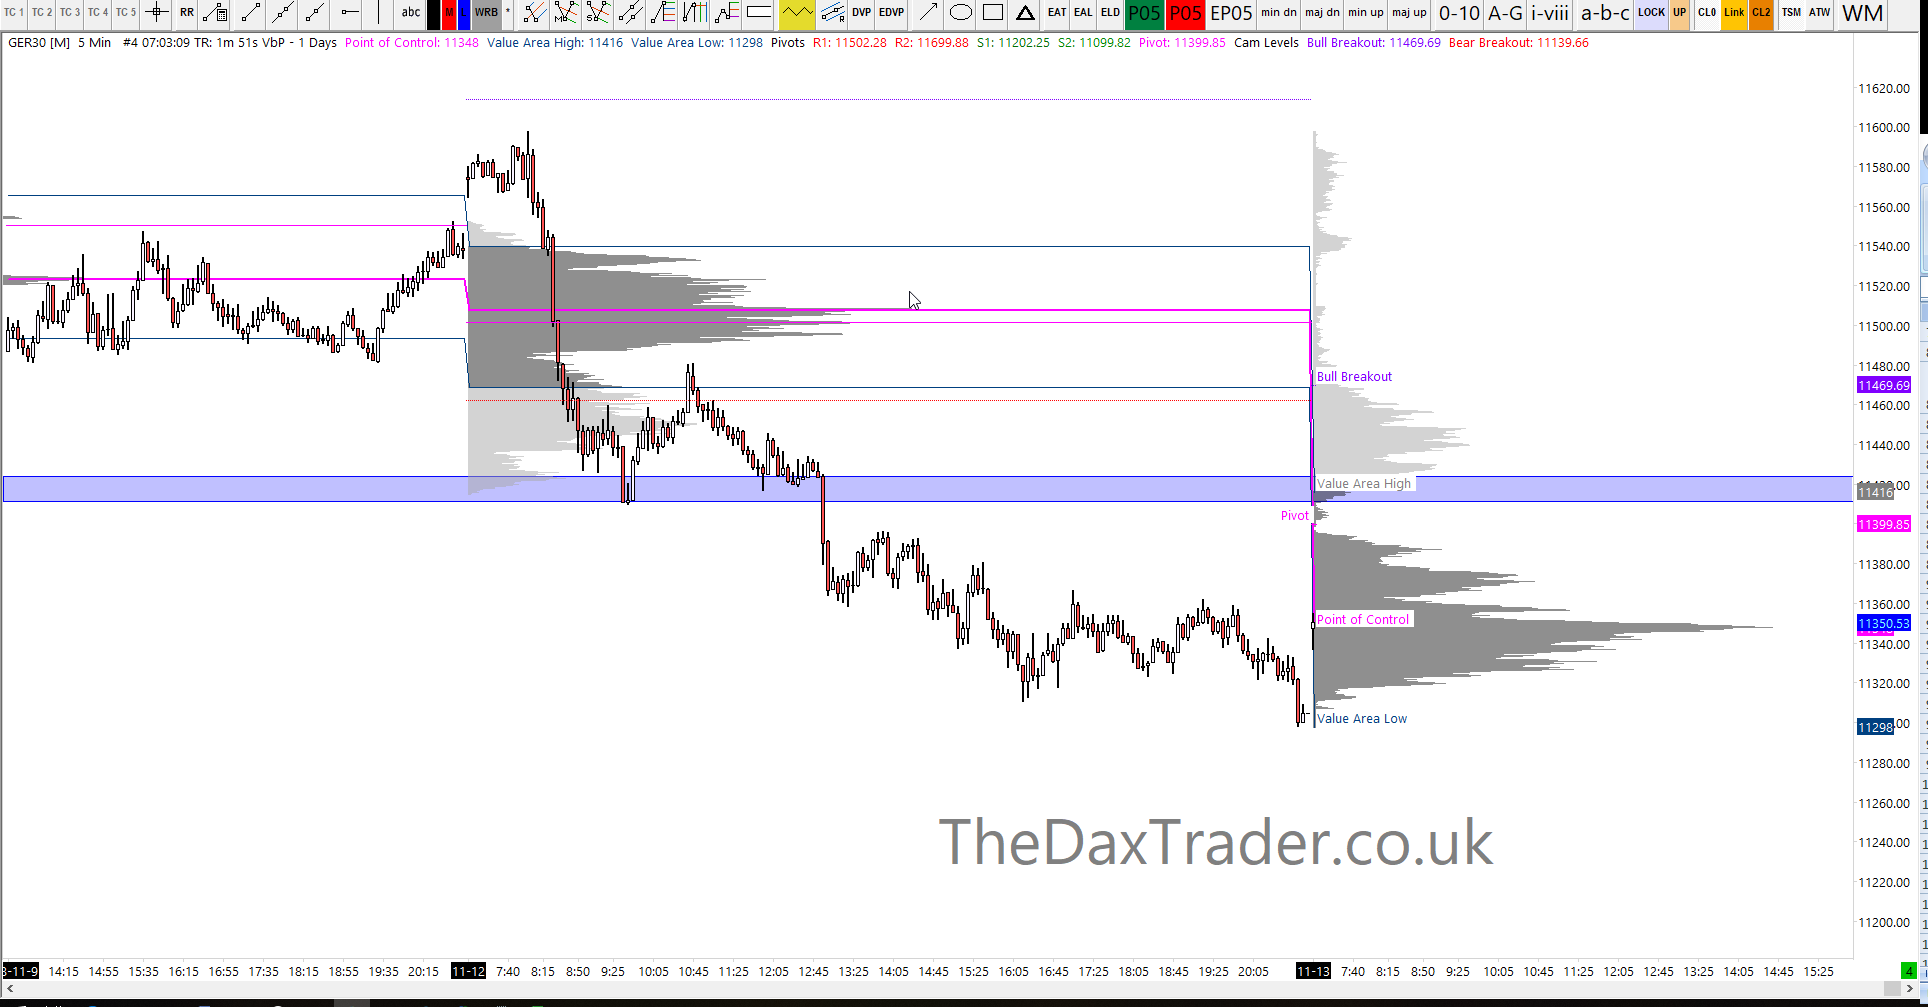
Profile
See the key levels below

Key Levels
| DAX | FTSE | DOW | ESTOXX | |
| Point of Control : | 11182 | 6974 | 24485 | 3135 |
| Value Area High : | 11187 | 6993 | 24556 | 3140 |
| Value Area Low : | 11145 | 6959 | 24417 | 3129 |
| VWAP : | 11173 | 6982 | 24443 | 3134 |
| R2 : | 11325 | 7095 | 24673 | 3166 |
| S2 : | 11030 | 6879 | 24185 | 3100 |
| Pivot : | 11177 | 6987 | 24429 | 3133 |
| Camarilla Breakout (Bull) | 11232 | 7024 | 24553 | 3145 |
| Camarilla Breakout (Bear) | 11070 | 6905 | 24285 | 3109 |


