Dax View
We have completed a 700+ point bullish reaction leg on declining volume and have now peeled away from the major high by over 1%. I am going to look for shorting opportunities, assuming that we continue to make lower lows and lower highs on the 10-minute chart and assuming that we can take out 12300. We have a large low volume area underneath 12300 with the next major value area closer to 12160. This looks like an interesting area to target.
A break above 12400 and ultimately 12445 will turn me neutral
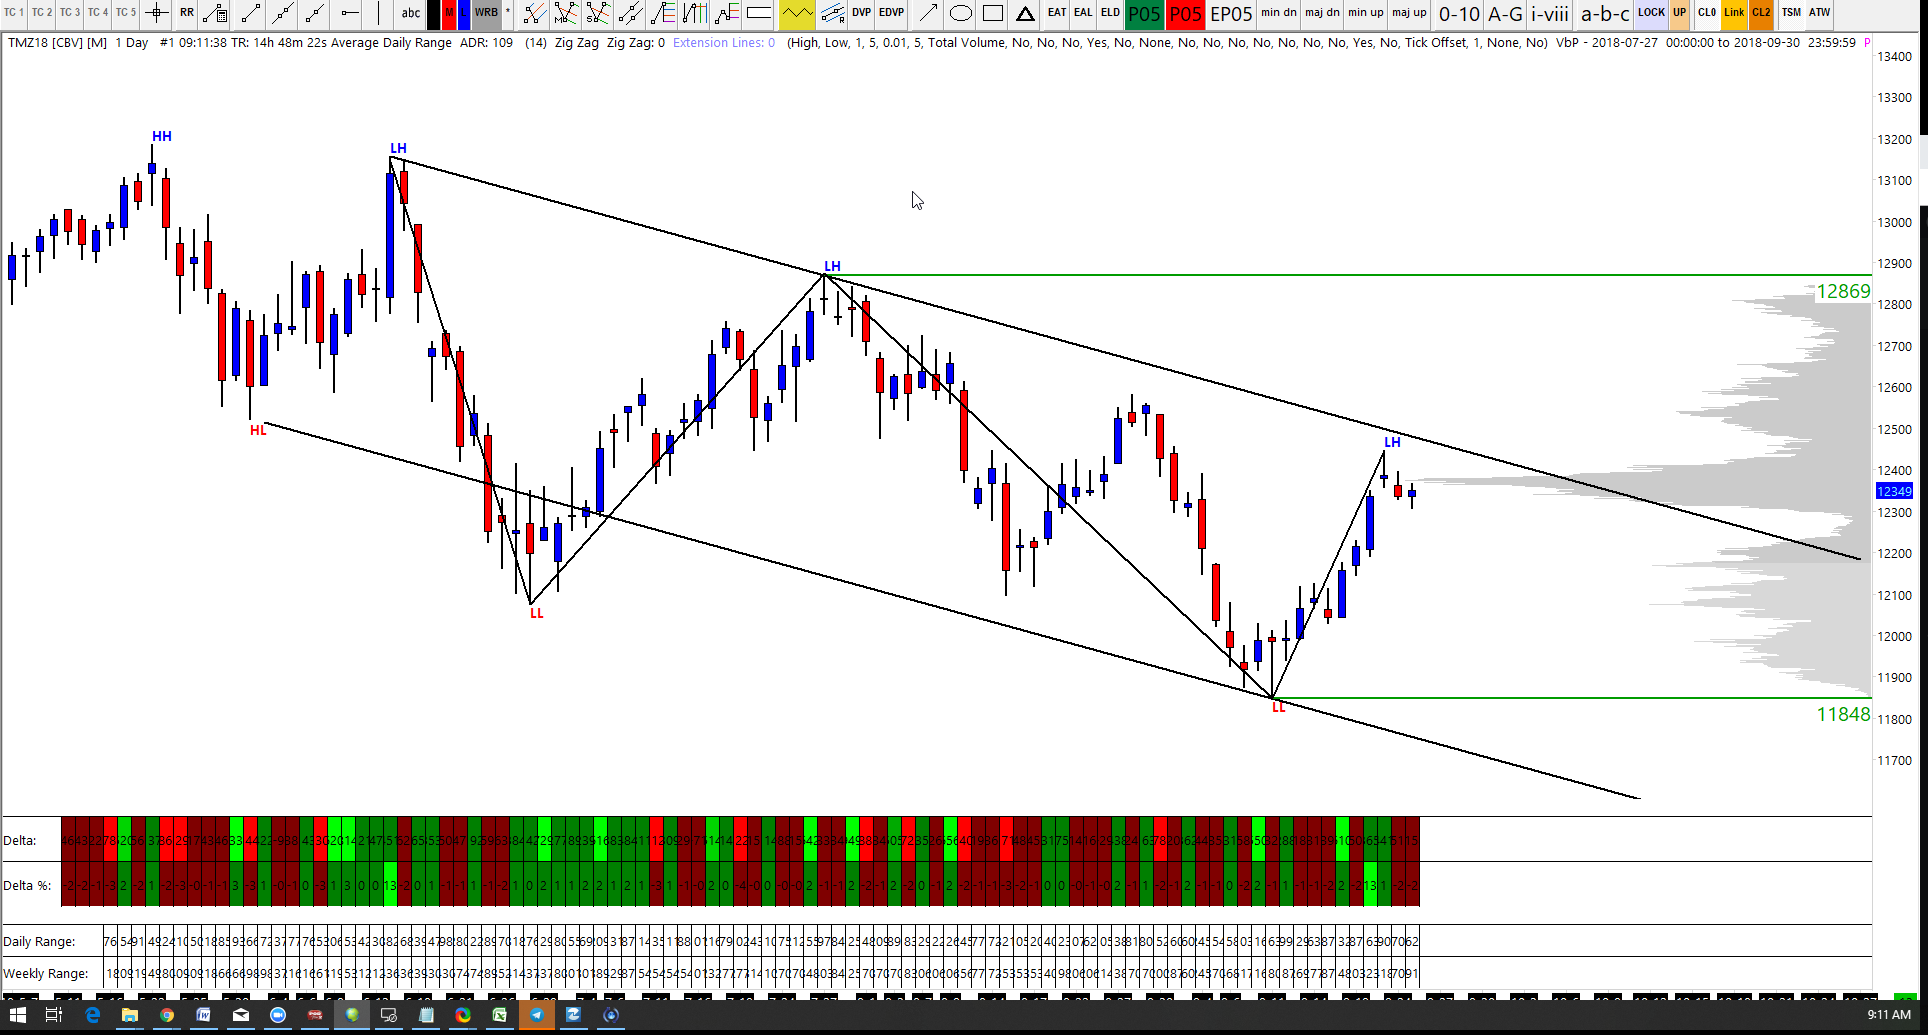
Daily Chart
The volume profile on the right is a ‘composite’ profile. This profile is drawn using the price action from the 12869 lower high, to now. Note the high volume area and compare it to current price. During this current Bullish Reaction Wave we have tagged the underside of this level which raises a couple of questions:
Perhaps this is an area for price to turn around?
What will happen around the low volume area below us?
60m Chart
The recent 700+ point bull run can be split into two minor swings. If we look at the cumulative volume for each swing, notice how the second, more aggressive swing formed on lower volume.

10m Chart
Many things happening on this chart.
- The green shaded area is highlighting a significant low volume area, based on the overall 700+ point bullish wave we have seen recently. Low volume areas are worth reading about. Don’t become obsessed with them, just having a basic understanding of what they tell you will help. If you are already a premium member, then there are already some excellent videos available to you on the member page. If you are not, then find out more here.
- I have drawn a downsloping regression channel and kept it on the chart because I like the way the center line is acting like a multi-pivot line and price is still respecting the levels.
- During the webinar presentation, one of our members pointed out in the chat that price was about to test the down-sloping high-to-high trend line (black line) and would enter a short. Good luck, as so far, that idea worked out nicely.
- I put a short idea on the chart
- 12300 could be a tricky barrier

Yesterday’s Price Action
Quiet day yesterday, only a 70-point range.
Notice the wide range bar in the middle of day yesterday? This, combined with a failure to retrace that move, and also combined with today’s break below the low of yesterday suggest a further move to the downside. Assuming 12300 is broken.

TPO Chart
Another point of control bites the bust. These are magnetic. Price will often revisit those heavily traded areas and you can often see a reaction there too.


