Good morning traders. We see some cool heads at the start of European trading today. All eyes will still be on Italy for signs of a relaxation in risk aversion, but I have to be honest here, I believe that Italy is the scapegoat for a much wider issue that is bubbling under the service.
I believe that we have many political and financial and economic problems that are about to erupt and those ‘responsible’ are more likely looking to place the blame somewhere else. The best way to place blame is to wait for a smaller issue to arise and then say this was the cause of the problem. But leaving my opinion to the side, so far the positive tones are seeing the euro rally to session highs and the DAX recover as well.
[special_heading title=”30-05-2018 DAX Analysis” subtitle=”DAX30, GER30, FDAX, FDXM, GDAXI” heading=”h2″ centered=”true” __fw_editor_shortcodes_id=”d38e3432e8a76291281e5d931b49d904″ _fw_coder=”aggressive”][/special_heading]
I have three forks drawn on this chart because I think they all play a role in forming a strategy. Fork 1 is the grey fork which begins on the left of the chart. This fork is interesting because the price could still use the underside of the LMLH as a point of interest. Fork 2 is the ‘downsloper’ which is currently containing price action. Yesterday in the article we discussed how price action had zoomed through the LMLH of the grey fork and then the ML of fork 2. When this happens, we often see price head down to the LMLH of the currentfork (after a pullback). So now we watch to see whether this current price action is that ‘pullback’. The final fork is horizontal [and perhaps drawn a little early] so another option is to see if we reach the ML from the underside, offering a sell opportunity.
The DAX is bearish below 13034
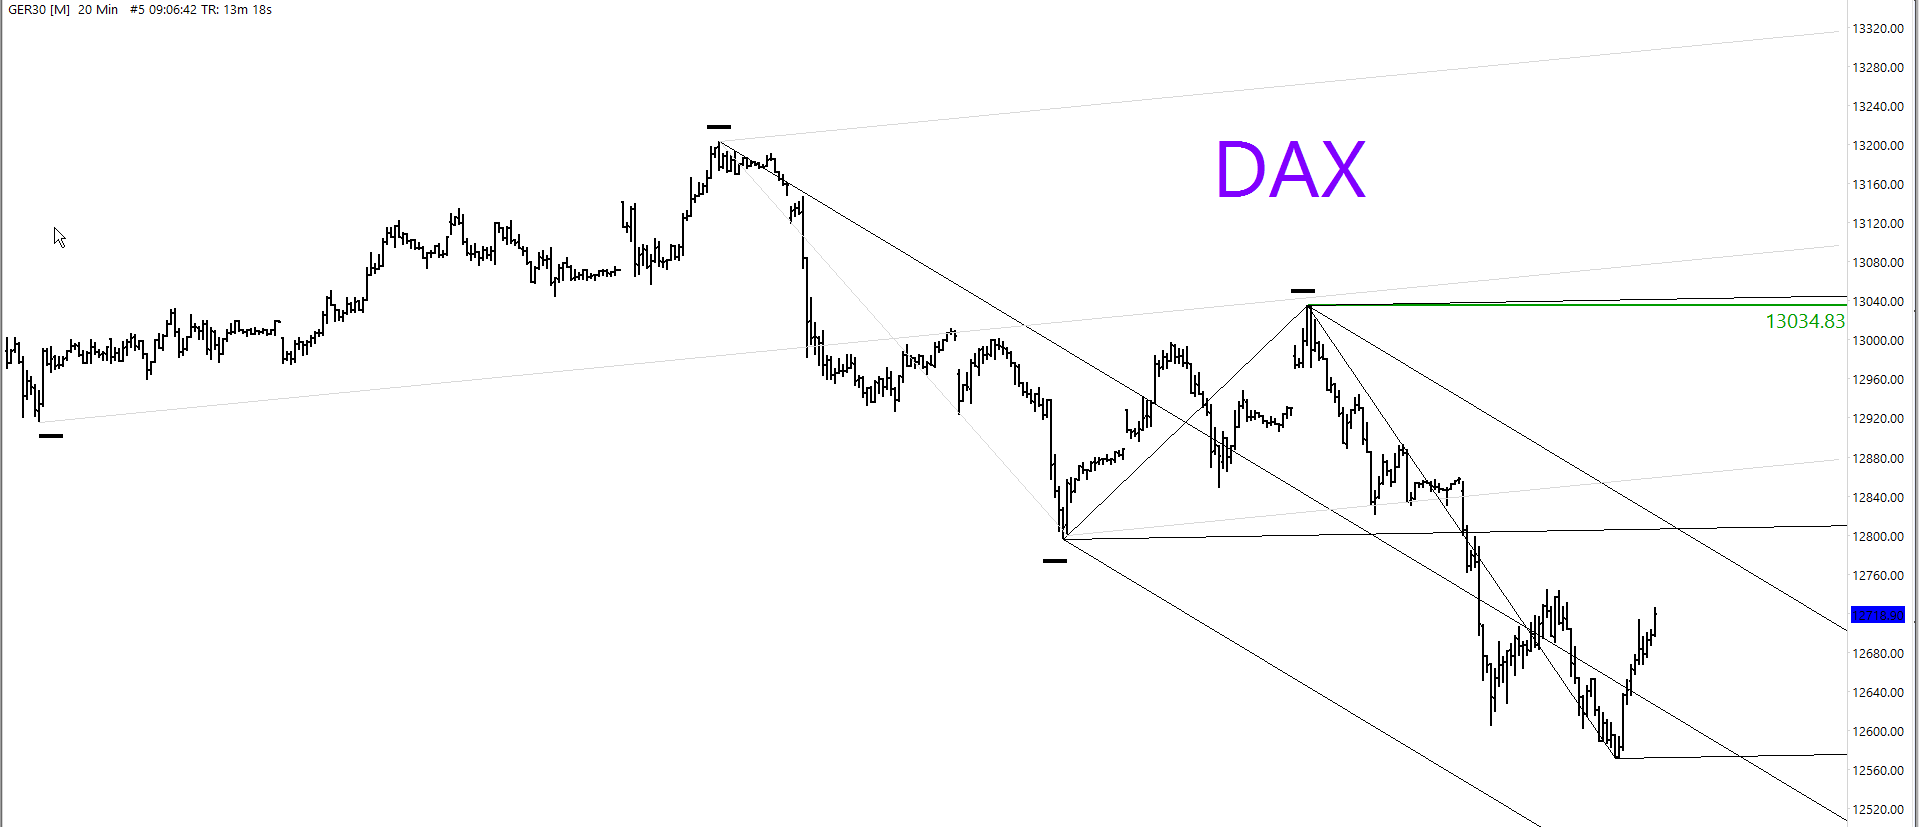
Look at that shaded zone, will that provide the point to get short? I have marked out that zone because it was a previous point of ignition and it shares a confluence with this minor ML.
The minor swings are clearly bearish and if we turn around and take out the most recent low, then the trend continues.

[special_heading title=”30-05-2018 FTSE Analysis” subtitle=”UK100, FTSE100″ heading=”h3″ centered=”true” __fw_editor_shortcodes_id=”7eefd9493f42ca40ef1398f0c5d8b619″ _fw_coder=”aggressive”][/special_heading]The recent bearish price action (which began from the recent all-time high) can be considered as a major bearish impulse leg. We can take that major impulse leg apart and break it down into its minor swings (blue markers). We can see the two most recent swing highs of 7738 (second swing back) and 7661 (trend defining level) as levels of interest. This market remains bearish below 7738.

[special_heading title=”30-05-2018 DOW Analysis” subtitle=”DJI, DJIA, US30, YM” heading=”h3″ centered=”true” __fw_editor_shortcodes_id=”d774aadb5fca27deb53aa41466569ec4″ _fw_coder=”aggressive”][/special_heading]
The price action on the DOW is still ugly, but there is more shape forming in the swings. We are currently bearish below 24902. But a break above 24626 will signal a break of the minor swing high and a potentially deeper pullback than anticipated. i have marked out the 24537 zone as an interesting spot for a short. This is because we would form a ‘coil before the V’ shape and it would be forming around the major ML.

DaxTrader Tools
Check The Economic Calendar |
Read Today’s Trading Ideas |
Advanced Swing Trading Course |


