Good morning traders welcome to the 31-01-2018 Dax Technical Analysis. The 13131 is an important level to watch, especially if we have another bearish day. The 13131 is a key support zone. We saw our first gap higher for a while this morning. I know it was only a few points (9 points according to FXCM), but let’s see if it sparks a recovery in the short-term, dare I say it, a bullish day? This morning we have also taken out 13232 which was a lower high based on the low from yesterday. This move signaled a move to the previous lower high (around 13272) and at the time of writing, we stalled there.
Bullish targets: 13315-13350
Bearish target: 13140-13175
31-01-2018 Dax Daily Chart
I chose this chart as it shows a developing story of interest. Firstly, this is a pitchfork drawn from three alternative major pivots. The median line through the middle is important because you would normally expect to see price touch the median line – but it hasn’t (yet). You would normally expect to see this median line touch before reversing. So right now the price action is threatening to break below 13131 (breaking that mini-trend which began at the most recent major pivot) and also potentially break below the lower median line parallel.
Therefore, this is either a potential bearish reversal, or a great bullish entry. Which side are you?

31-01-2018 Dax Hourly Chart
If we take a look at a different board (the hourly chart), we have this little downtrend in play and after marking out the minor pivots, we can draw a fork here as well. The confirmed trend makes things more difficult to be a buyer at the moment. However, if we do turn bullish from the previous comment on the daily chart, then I would like to see us back as this shaded zone. There is a lot of resistance to contend with, but only a move like that will signal that the buyers are back in control.
Sellers will be targeting a failed attempt to break above the most recent lower swing high and eventually break below the recent swing low to continue the bearish trend.

31-01-2018 Dax 5m Chart
Trend lines do not always tell the full story, but this particular line is acting like a heavy weight, pushing and compressing price and the price action is obedient at the moment. If we break above this press line, then we watch for either a fake break, or a kiss goodbye of that line and potentially get a long entry. Any longs into this kind of downtrend are high risk, so I will want 4:1 reward at least.

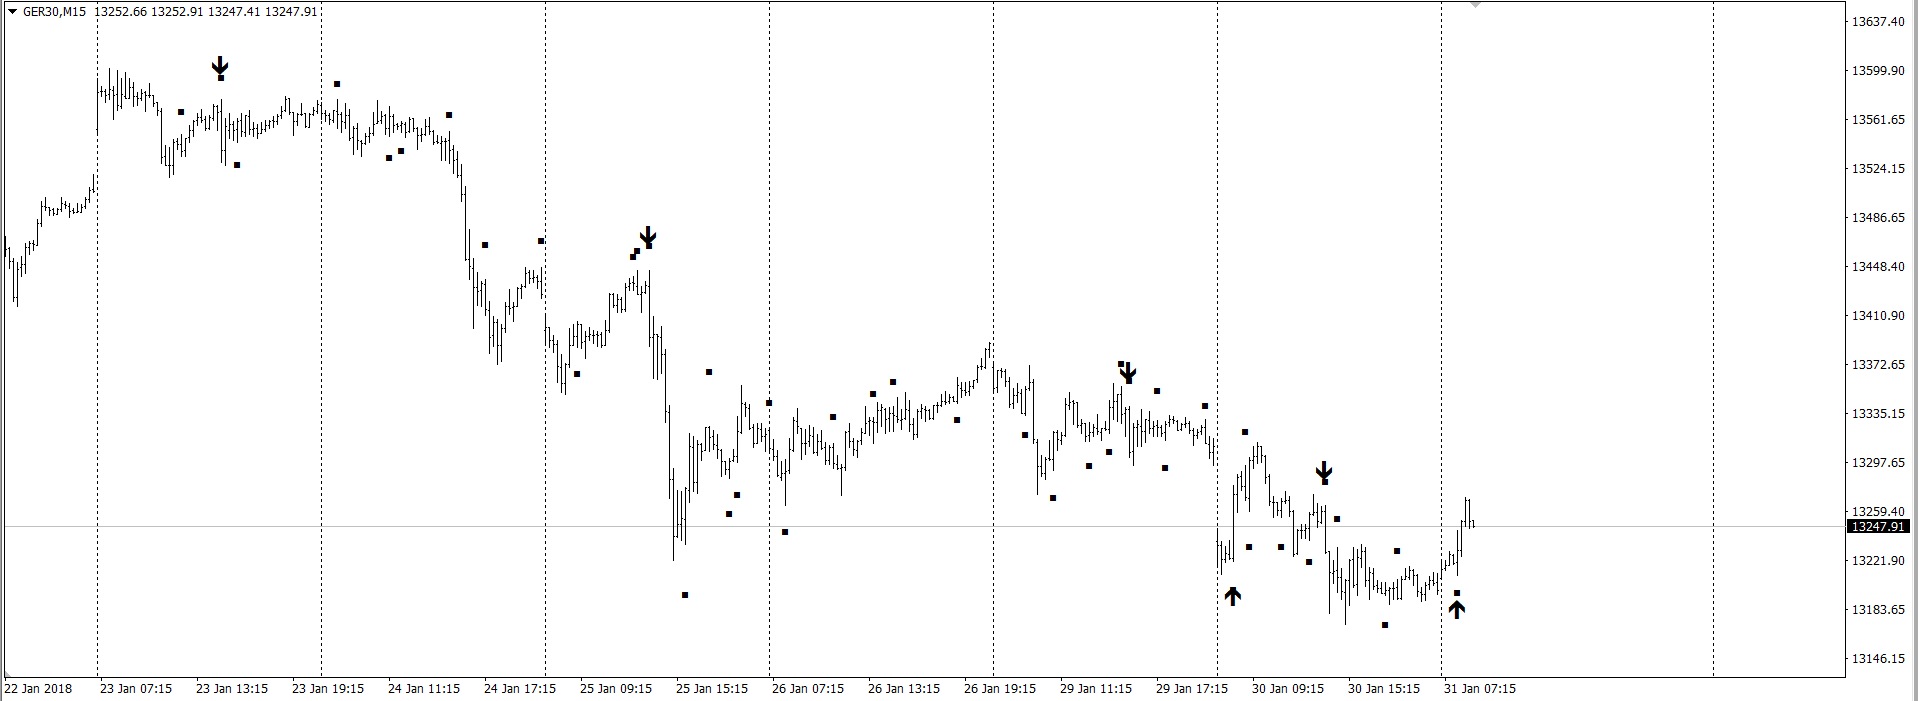
A New Indicator
I built a new indicator tomorrow which I am currently testing, but it is marking out two things
Arrows = Wide-Range Outside bars (larger than normal candles that have a higher high and a lower low than the previous candle)
Dots = Outside bars only
Premium members – come and join me on Friday and we will code our first indicator.
31-01-2018 Dax Key Levels
| KEY LEVELS | |
| POC * | 13200 |
| Value Area High * | 13258 |
| Value Area Low * | 13189 |
| 14 Day ATR | 145.47 |
| 200 EMA | 12677 |
| 50 EMA | 13184 |
| Daily R2 | 13368 |
| Daily R1 | 13284 |
| Daily Pivot | 13228 |
| Daily S1 | 13143 |
| Daily S2 | 13088 |
| *These are FXCM numbers, not futures numbers. Please be aware that FXCM can often be 5-10 points higher than futures prices | |


