| FINAL SUMMARY | DAILY OUTLOOK |
[wp_ad_camp_1]
Final Summary

Triangle formations
So not a great deal to report this afternoon, the market is pretty much back to where it was. The range is closing in even further now and I suspect we could remain in this box for a few more days. There are a few interesting setups emerging on the charts. Two triangle formations are forming and there is a head and shoulders pattern as well.
Mornings could produce the interesting moves next week so I should get myself ready for some intra-day early trend following trades, but for the longer swing trades, I am watching for a significant break of the outside triangle pattern formation.
Next week outlook (if pushed): Ranging early on, potentially breaking out towards end of week.
Midday Update
So here we are again, back in the range after a fake breakout earlier, which I traded and was stopped out on. I have another signal to sell, so I am going to have another go at this shortly, just waiting for a decent entry. I can’t imagine anything is about to trigger a massive break out today, we are still coiling, we need a catalyst. I had a few guys on StockTwits commenting that the Japan GDP is going to cause a few waves and I agree, this could perhaps provide the needed catalyst. So I will wait for a bigger trade entry until after the weekend.
I entered a few trades back-to-back earlier, from a combination of premium signals and my own signals. They seem to be doing ok at the moment, swinging around but we’ll see if anything comes in before the end of the day.
(Edit) I just noticed that I have a buy signal now, so I will not be entering a trade.
Dax Daily Outlook
Today we are trapped in a fairly tight range and I am still waiting for a break out before trading. The range is now tighter than over the last couple of days and seems to be compressing and coiling. The daily chart and recent stalling in price action suggests plenty of supply and perhaps a break to the downside, but I will wait to see which way it wants to move. If we break above the 9300 level I will consider a long and if we break below the 9100 level I will consider going short.
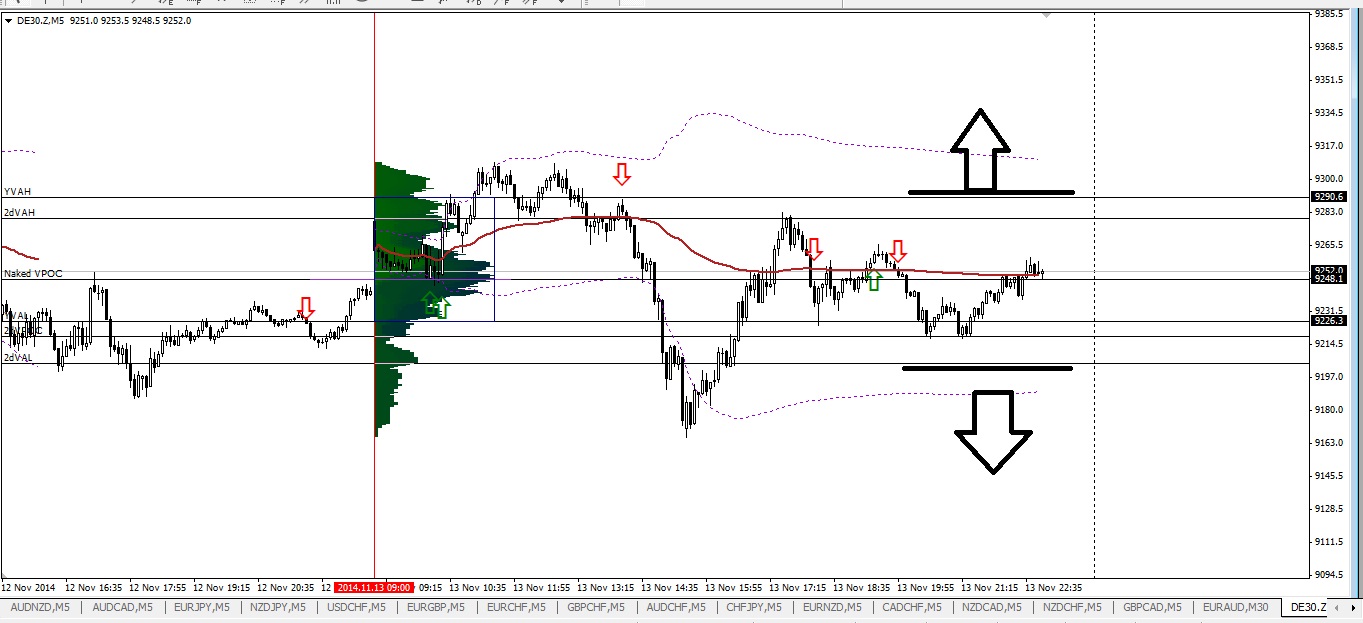
Trapped in a range
On this chart (drawn last night) I have drawn the vpoc, value area high and value area low for the last two days and it just so happens that these levels define the range we are currently trapped in. I also notice that we are coiled around four major levels: the developing vpoc of today, the naked vpoc from yesterday, the current 24-hour vwap and the daily pivot!
Heavy consolidation, spinning top yesterday, small range today, we are building for something.
I am currently short the SPX, EURUSD and AUDUSD. I had a short on USDJPY stopped out last night.
[wp_ad_camp_3]
Key Levels
| KEY LEVELS | |
| Daily R2 | 9386 |
| 200 Day EMA | 9340 |
| Value High | 9290 |
| 24hr VWAP | 9249 |
| Naked VPOC | 9248 |
| Daily Pivot | 9244 |
| Value Low | 9226 |
| Daily S2 | 9102 |


