Good morning traders!
And just like that, we are into June and racing towards the end of yet another week!
[warning]ECB DAY TODAY[/warning]
[warning]Initial Jobless Claims, ADP & Fed speech[/warning]
[warning]Mark Carney speech[/warning]
Expect plenty of volatility today and tomorrow as the are plenty of high impact news events on the way!
Call me stupid if you like, but I don’t trade the news, I will trade the trend that develops afterwards though.
It’s unlikely that we are going to get any more easing from the ECB, unless they throw a big surprise (which would be massively bullish in the short term, before people realise that it will only cause potential inflation issues). Inflation is bound to be impacted by the slight recovery in oil, so they don’t really need to increase. They are already easing enough as it is. They may revise their inflation outlook (2018) lower, which could see some interesting developments in price action, but it’s likely that the market will begin to expect, and then price in, an extension to the program beyond March 2017.
Looking at the technicals, we are short-term bearish below the yesterday morning high of 10285 and sitting at the top of the mini trend channel looking to decide the next direction. If we break the afternoon high of 10220, price will look to head up to test 10285 again. Zooming out to the 30 minute chart, we are still stretched long so price can definitely withdraw a little more from here and it not raise too many eyebrows. We have almost reached the 38.2% retracement of the recent swing and approaching the ideal buy zone closer to 10075.
Bears will be looking to short from current levels, perhaps with a stop above the high of yesterday, perhaps with a tighter stop closer to 10225 and then looking to target a break below the 10150-10165 support zone before hitting stronger support at 10100.
Bulls will definitely be looking to take advantage of the growing bullish divergence between the oscillators and price action on the 30 minute chart as it can offer a good probability trade setup when approaching an area of support, which we are.
Would you like Dax trading signals sent to your phone?
Dax Support & Resistance
| KEY LEVELS | |
| Daily R2 | 10345 |
| Daily R1 | 10277 |
| Daily Pivot | 10219 |
| Daily S1 | 10151 |
| Daily S2 | 10093 |
| 200 Day EMA | 10153 |
Dax Charts

01 Dax Daily Chart

02 Dax H4 Chart

02 Dax H4 Chart

04 Dax m30 Chart
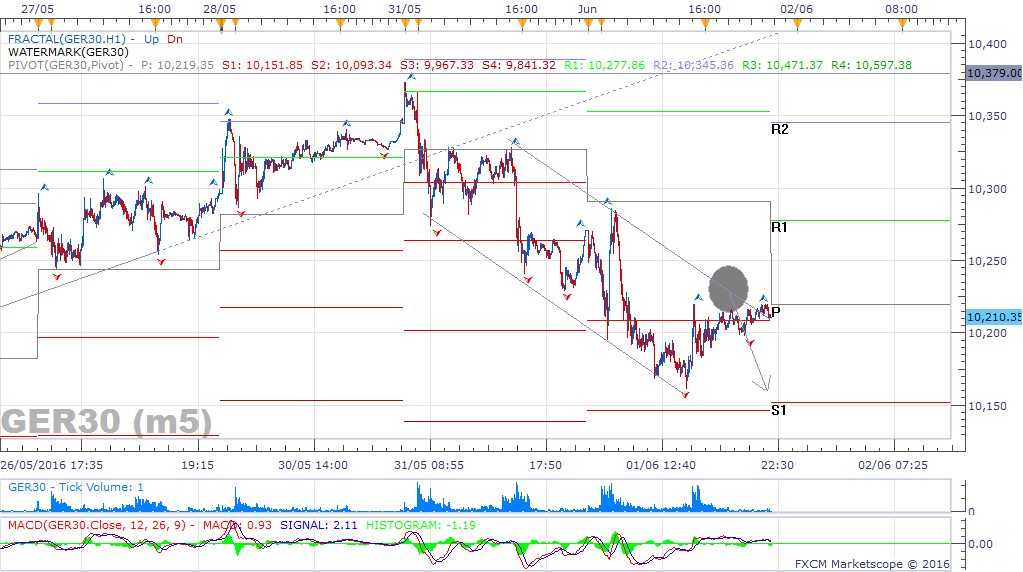
05 Dax m5 Chart


