Hello Traders!
I hope you all had a great weekend.
Regarding news over the weekend, EU are planning to bill every UK citizen EUR 500 if PM May fails to pay the Brexit divorce settlement which is estimated to be around EUR 60bln, according to news sources. There are certain commitments (financial) that the UK agreed to over the last year or so and the EU are eager to ensure that they continue to see that commitment through, it is widely expected that May will honour those agreements.
Look ahead this week, we have lots of manufacturing and PMI data, US Construction Spending, ECB’s Coeure, Fed’s Dudley, Lacker and Harker so watch out for those.
Looking at the Dax, we have seen a strong bullish run since breaking above 11500 and the price is now, at the time of writing, just 40 points below the all time high of 12400. RSI on the daily chart is now overbought, which doesn’t necessarily mean anything, but suggests that selling signals are now likely to be seen as more significant. At the moment we do not see a selling signal on the daily chart, but we are aware that being overbought, at a major resistance level, provides excellent conditions for these signals to emerge. From a technical perspective, could price continue to rally beyond the current price and beyond the all time high, without a pullback? Yes. The dax doesn’t always respect textbook technical moves. But a good example of this type of standard move would be a retracement back to a support level like 12,100 or 12,000.
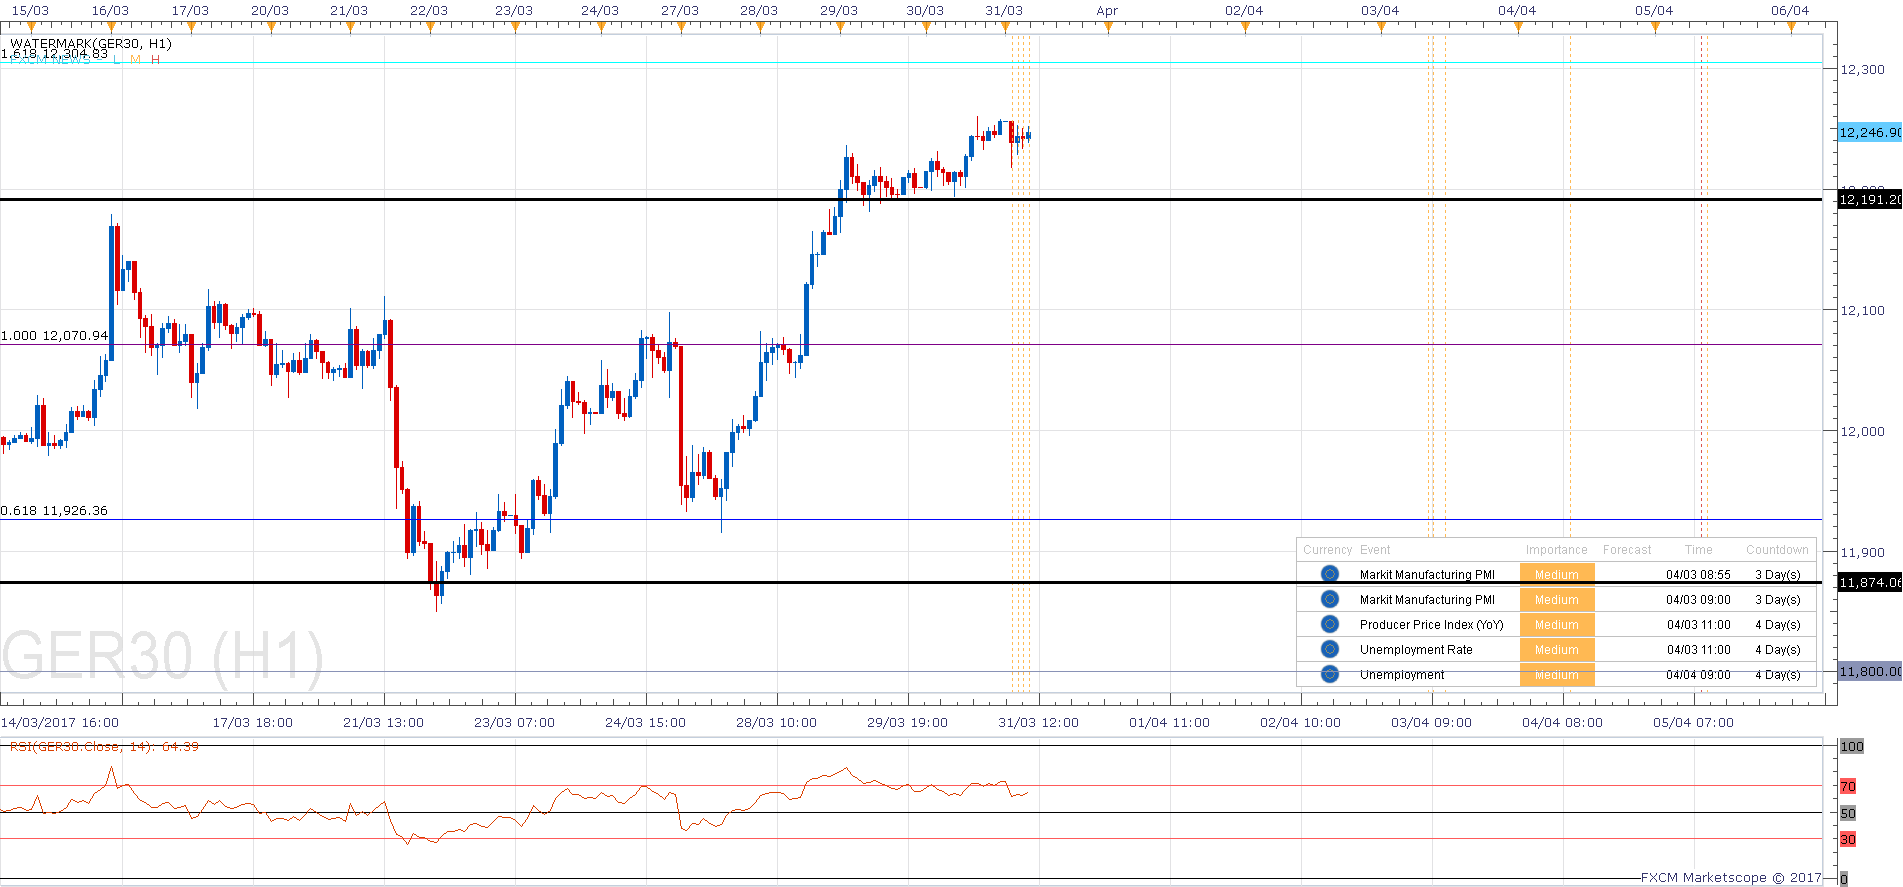
The hourly chart shows the resistance levels more clearly and there is divergence here (bearish) at the resistance level. I mentioned that there was not a selling signal on the daily chart, but this could be considered a selling signal on the hourly chart. So I am keen to watch how that develops.
The five minute chart does show price above the Bollinger band, but there is no divergence or any significant signal (in my opinion) to suggest it’s time to sell. We gapped higher this morning, opening up an opportunity to buy at the bottom of that gap, should it close. RSI is now back under control again, which may support the dip buying view.
The algorithm is still bullish. I am just aware of the risk of going long, being so close to this major resistance level.
DaxTrader Advert
I have created a Forex (and commodities and Indices) broadcast channel to provide alerts for setups that come from my new indicator. It’s a great way to test the signals and keep a track of them, so if you’re interested in being involved with the ‘experiment’, come and join that channel (on Telegram): If you’re interested in receiving live trading signals for the Dax, come and join the community. Three months of signals will cost £94 and can be purchased using this link: https://www.paypal.me/DaxTrader54/94 . In the meantime come and join my broadcast channel on Telegram messenger, it’s here that I broadcast additional Dax analysis and messages to my readers and subscribers. For the rest of the month, it is very easy to get access, please download the Telegram messenger (from www.telegram.org) and then click this link: https://telegram.me/daxtraderforex
If you’re interested in receiving live trading signals for the Dax, come and join the community. Three months of signals will cost £94 and can be purchased using this link: https://www.paypal.me/DaxTrader54/94 . In the meantime come and join my broadcast channel on Telegram messenger, it’s here that I broadcast additional Dax analysis and messages to my readers and subscribers. For the rest of the month, it is very easy to get access, please download the Telegram messenger (from www.telegram.org) and then click this link: https://t.me/joinchat/AAAAAEAypsW3Xet_6ngBlw
Dax Charts

03 H1 Dax Chart

05 Dax m5 Chart
Dax Support & Resistance
| KEY LEVELS | |
| Open | 12260 |
| High | 12344 |
| Low | 12218 |
| Close | 12321 |
| Range | 126 |
| Change | 0.50% |
| 14 Day ATR | 108.44 |
| Daily R2 | 12417 |
| Daily R1 | 12367 |
| Daily Pivot | 12291 |
| Daily S1 | 12241 |
| Daily S2 | 12166 |
| 200 Day EMA | 11169 |


