Good morning traders!
The Austrian election and the Italian referendum have dominated headlines this weekend. Austria has rejected the possibility of the Eurozone getting its first far-right head of state, which would’ve been pretty bad in my opinion. Italy has said no to Matteo Renzi’s reforms and has resigned from his post. There are stories commenting on how this could be confirmation of the end of the EU which will scare investors. The weekend IG market shows price plummeting to a new low, near 10350 before recovering to 10455 (at the time of writing). The significance of the no is that the most likely successor to take over in Italy would be a Eurosceptic who looks to hold a referendum on the Euro. And the markets are plunged into uncertainty once more.
Dax Technical Analysis
On Friday we reached a new low of 10,402. I had marked out three levels of support based on previous rejection points from the daily chart and on Friday we pierced the first one. Despite this, we actually finished higher on the day closing at 10526. 200 day EMA is it 10 370 just below the second layer of support I marked out on the daily chart. Overall there are still bound by the long-term range, so balls may find a better price on open first thing this morning.
On the four-hour chart, there was a decent bounce from the 61.8 retracement which was also the love of Bollinger band. Oscillator found the oversold zone and has now crossed to the upside. There is no divergence between price and the oscillator, so the signal may not be very strong.
On the 1-hour chart, the break below short-term range support 10 570 was significant. Price has been looking to test the underside and reached a 50% retracement from the 30th November high. If this is indeed a downtrend then we are bearish below 10 700.
On the five-minute chart 10 550 is an interesting level in the very short term. A break above this level could take us up to the daily resistance zones. After the Italian result, it is more like the bearish case will be more favourable today,
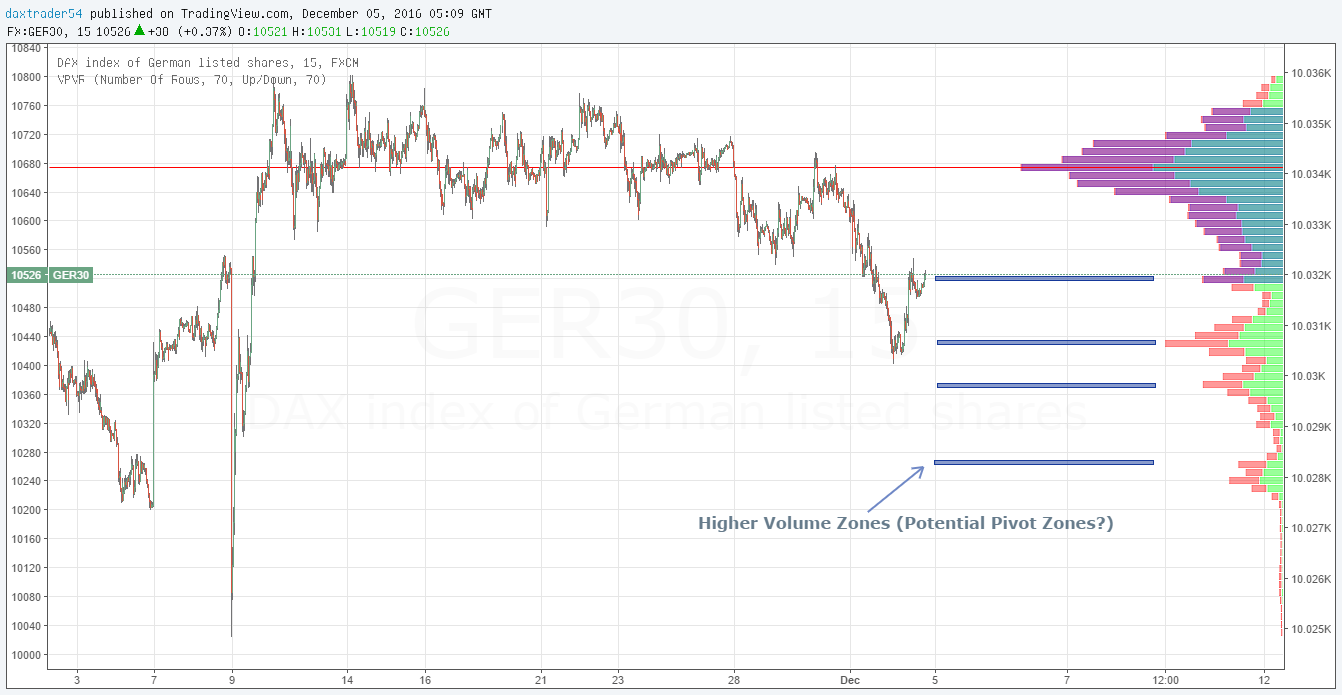
On the 15 minute chart with the volume profile, I have marked out for areas of potential support which may act as pivot zones. These are based on higher volume nodes that may hold price as we fall. In contrast, they may also act as profit targets if price starts low today (because of Italy) and then recovers.
Dax Support & Resistance
| KEY LEVELS | |
| Daily R2 | 10636 |
| Daily R1 | 10581 |
| Daily Pivot | 10492 |
| Daily S1 | 10436 |
| Daily S2 | 10347 |
| 200 Day EMA | 10370 |
Dax Charts
tv-15m-dax-chart

01-dax-daily-chart

02-dax-h4-chart

03-h1-dax-chart

05-dax-m5-chart


