Good morning traders!
So after the extended holiday weekend we are back to business at the monitors and watching the Dax again. I currently have two open long positions around 12000 and I am still bullish, so long as we stay above 11600.
The contrarian view is beginning to pick up a head of steam as the longer term picture points to a complacent German economy walking into the summer months off all time highs and near record gains with the unsustainable growth needing a deeper correction. The trigger may very well come in the form of the situation in Greece with looming repayment defaults sure to send shockwaves around the financial markets. So I would personally be happy for the positions to be closed and flat for the rest of the week and may consider closing up before the end of the day if I get a chance. The weaker than expected NFP figure will also create a potential head ache upon open today too, but many believe that this will recover pretty quickly.
On the bullish side, the ECB are still committed to their monetary policy and stimulus program, the bull trend is still intact, many analyst are strongly of the believe that the trend can and will continue, I agree, despite all the opposition.
[twitter-follow username=”DaxTrader54″ scheme=”light”]
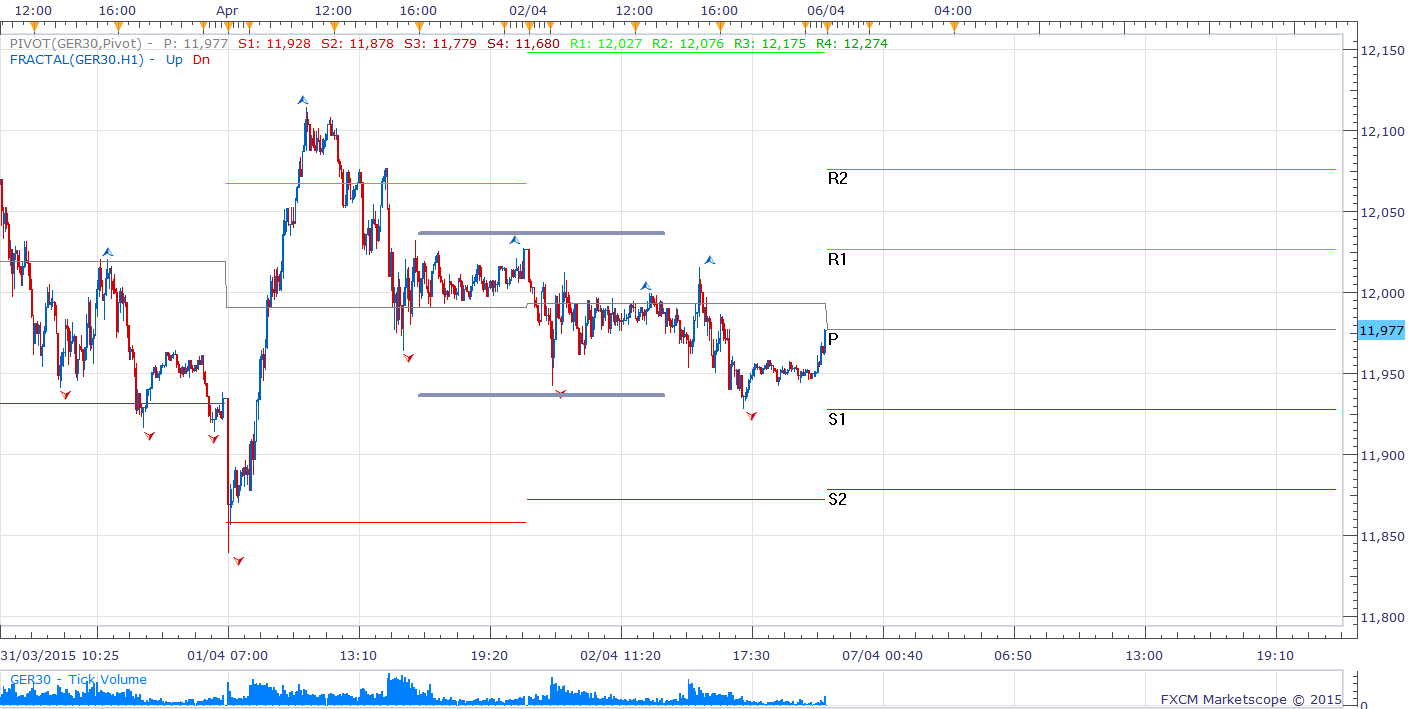
Dax Support & Resistance
| KEY LEVELS | |
| Daily R2 | 12076 |
| Daily R1 | 12027 |
| Daily Pivot | 11977 |
| Daily S1 | 11928 |
| Daily S2 | 11878 |
| 24hr VWAP | 11978 |
| Naked VPOC | 11985 |
| Value High | 12001 |
| Value Low | 11962 |
| 200 Day EMA | 10289 |
| 34 Hour EMA | 11985 |
Dax FXI Analysis
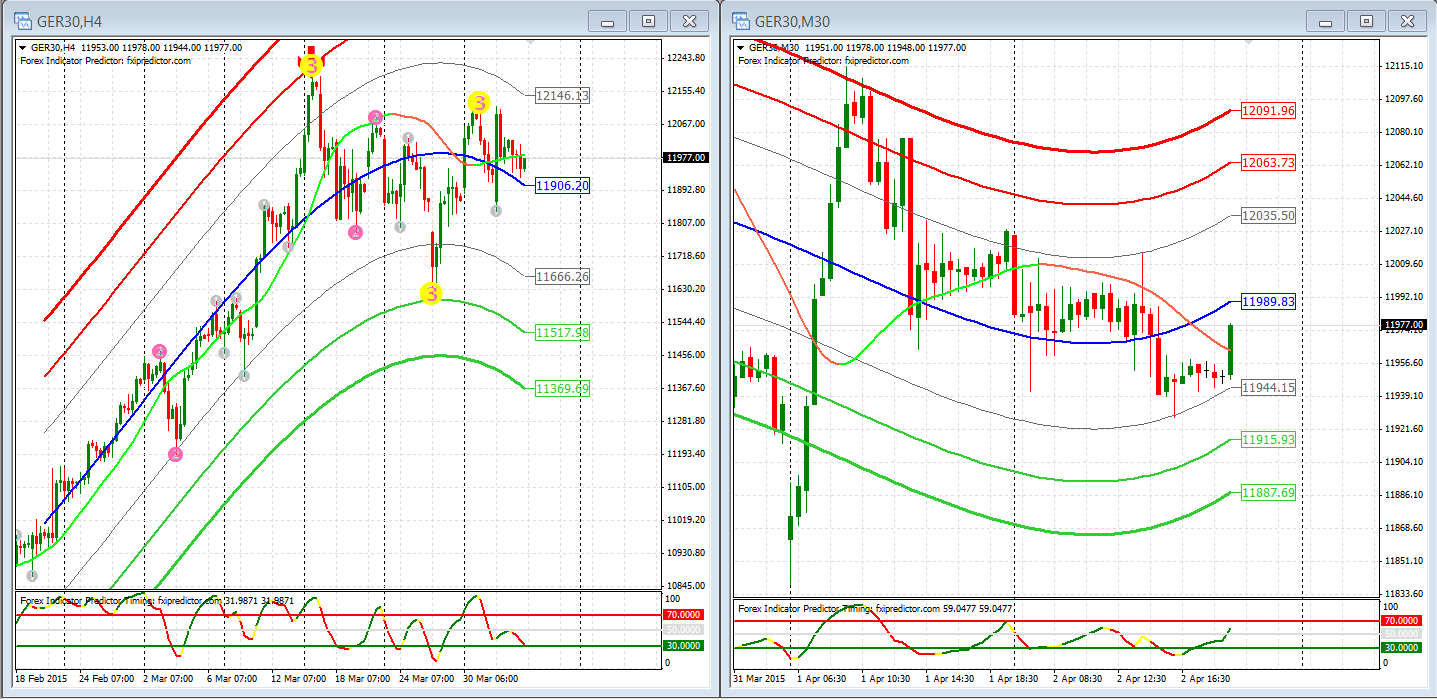
I am watching to see if we hold the 11906 level on the four hour chart, the oscillator looks like it’s finely balanced and ideally I would like a better price to get in. The channel is beginning to turn from sideways to negative and is still trapped in a compressing range. On the 5 minute chart, I don’t see any clear buying signals. I would be watching for a hold above 12000, or an entry much lower down.
Read more about this indicator here: https://thedaxtrader.co.uk/forex-indicator-predictor-review/
1Dax – FXI Indicator
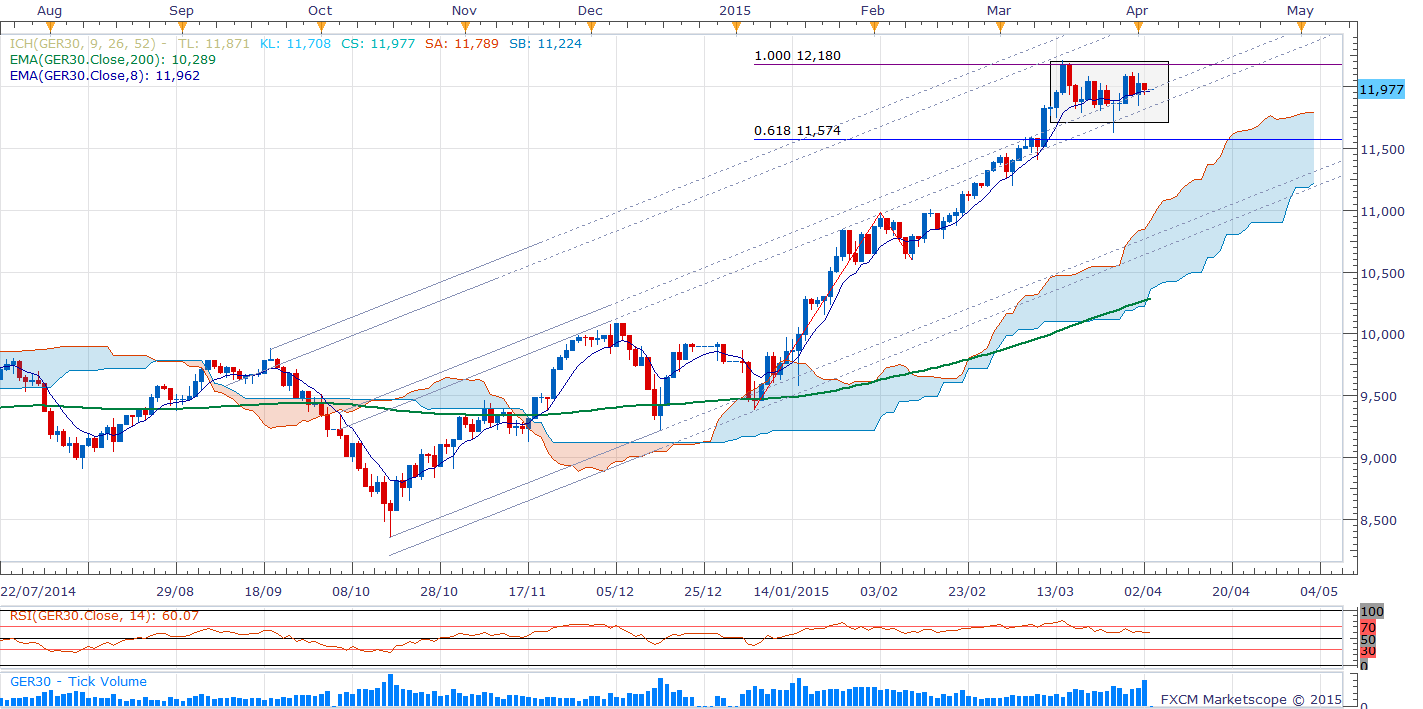
Dax Daily Chart Analysis
The box is still clear to see, price is trapped and still moving sideways, but a breakout will happen soon.
2Dax Daily Chart
[wp_ad_camp_2]
Dax Intra-day Chart – 4 hour
Another layer of support added and we are being pushed higher towards the ceiling. There is a risk of a fairly quick crash through various support levels soon, but for now the momentum is still there.
3Dax Intra-day Chart (4 hour)
[wp_ad_camp_1]
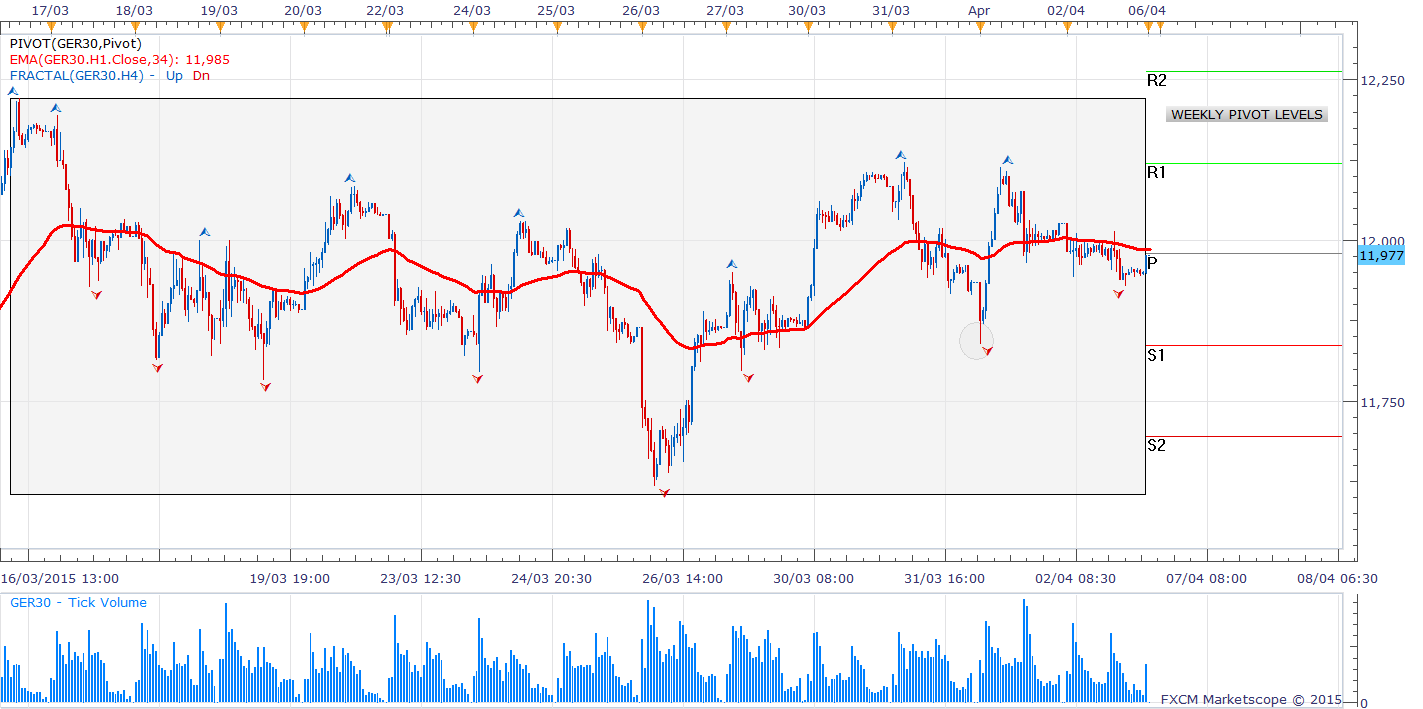
Dax Intra-day Chart Analysis – 30 minutes
Another image clearly showing the consolidation of price action. We are moving sideways and the weekly pivot points seem to simply mirror the highs and lows of the range.
4Dax Intra-day Chart (30 minute)
[wp_ad_camp_3]
Dax Intra-day Chart Analysis – 5 minutes
5Dax Intra-day Chart (5 minute)
[wp_ad_camp_2]
Dax Volume Profile Analysis
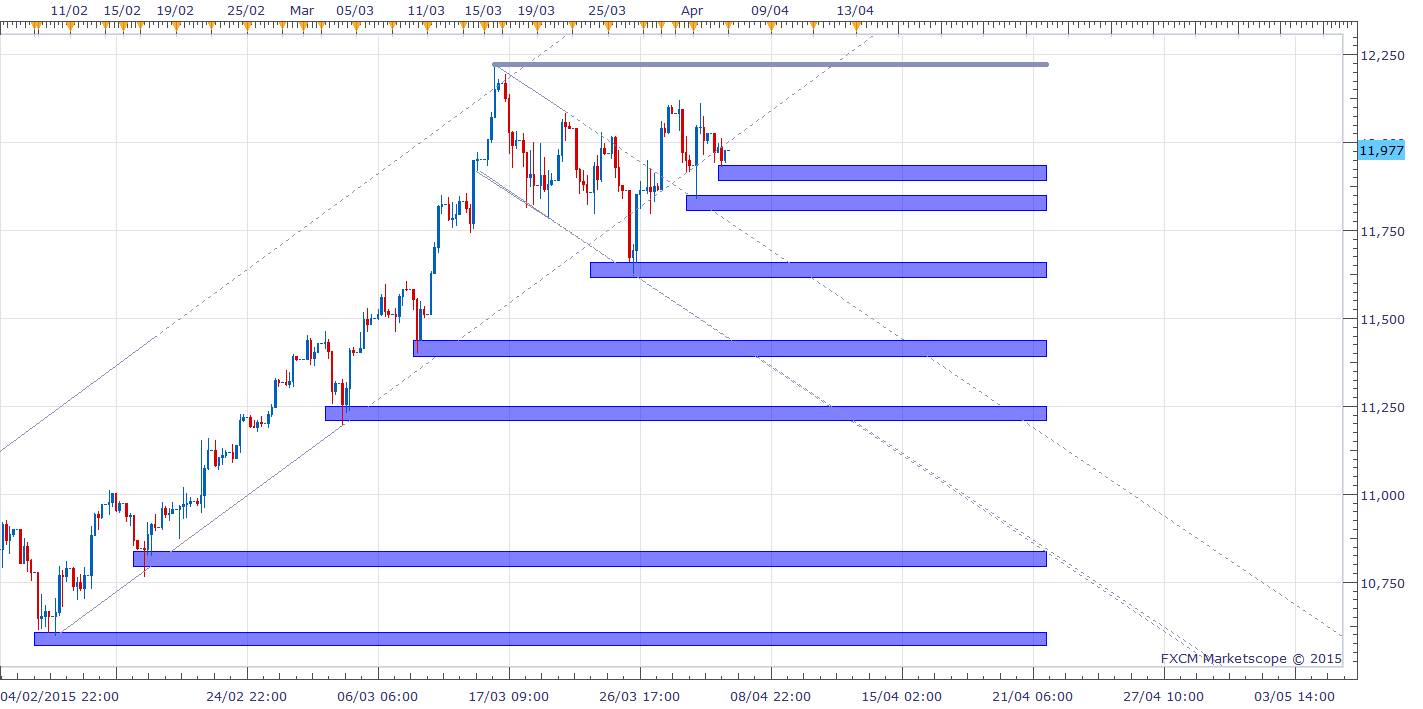
I like a break above the value area high from Thursday and if we do that, we can start to see a decent climb back towards 12150. Alternatively, if we don’t continue moving sideways, a fall under the value area low, can open up 11850 again. Look at the second volume profile picture, five days previous you will see a day with multiple mixed arrows compressing into a neat triangle before a large breakout to the upside. Those gains have been parred, but the recent 11850 low coincides with that breakout and price bounced again from this. I suspect we have a decent entry there.
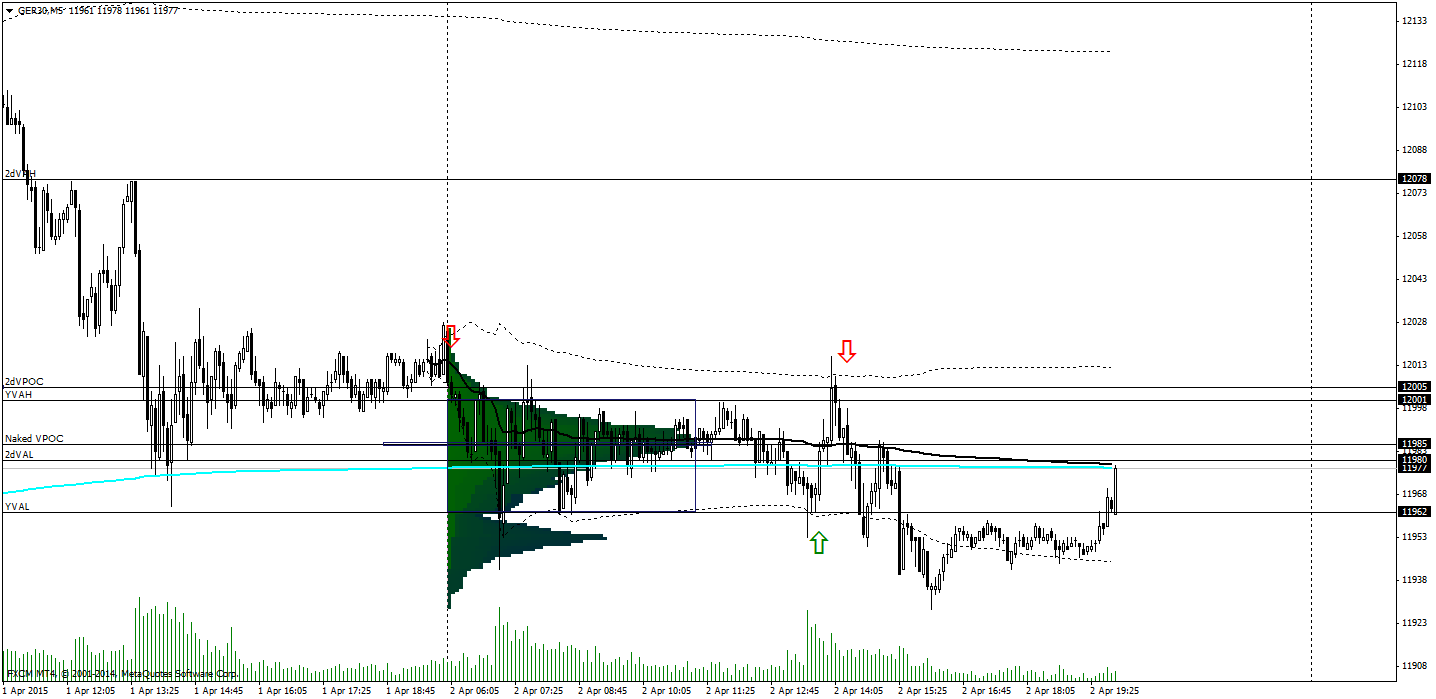
6Dax Volume Profile Chart (5 minute)
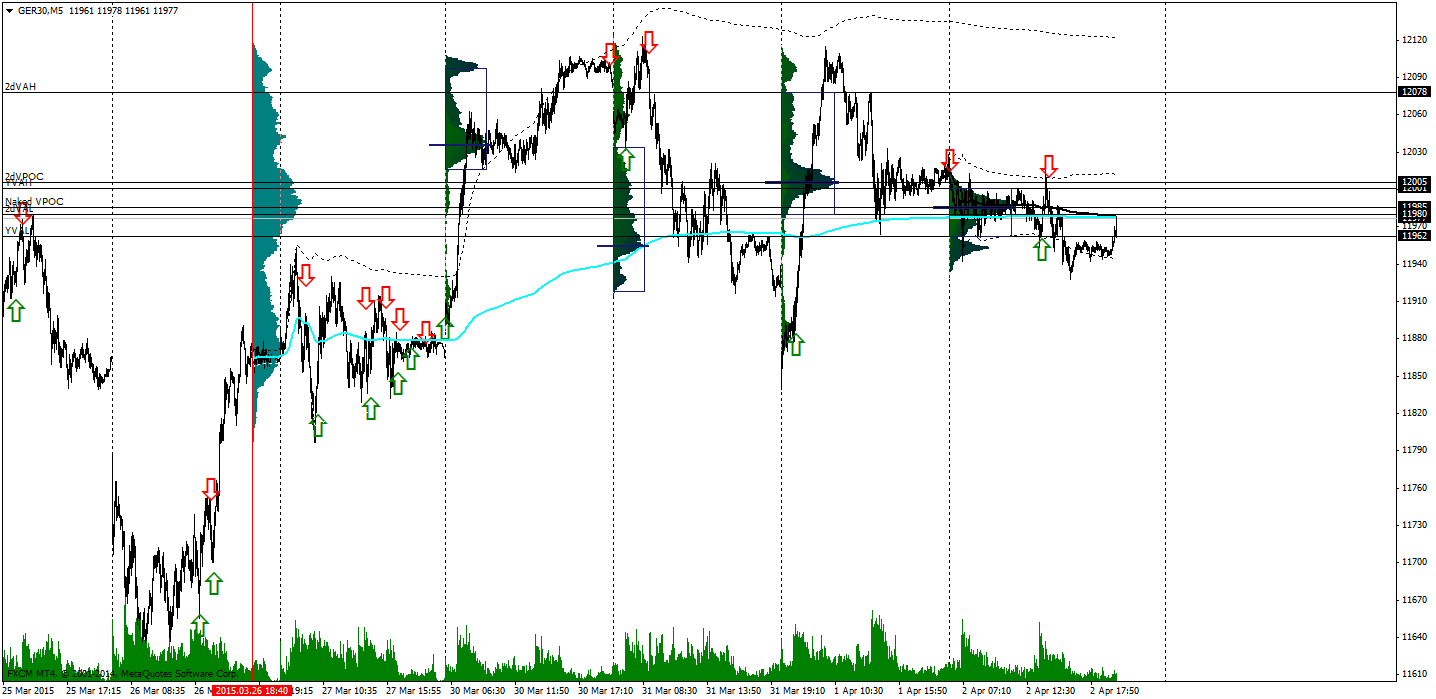
6Dax Volume Profile Chart (5 minute)2


