Good morning traders!Stock markets are enjoying themselves at the moment with the record hunt on Wall Street giving stock markets in the far east further impetus. The prospect of economic stimulus from the future US president Donald Trump is that a source of optimism.
Stock markets are enjoying themselves at the moment with the record hunt on Wall Street giving stock markets all over the world, especially in the far east, further impetus. The prospect of economic stimulus from the future US president Donald Trump is a source of optimism.
One more reason that we may well be seeing this incredible rally on the Dax, is because many analysts and traders are pricing in the fact that the ECB will once again be showing off its generous side. They believe that it will once again extend the multibillion-dollar easing program and this will have a positive effect on the Dax. Super Mario is also widely expected to comment on the shocks of Italian banks. So there is likely to be some volatility and focus now shifts to that event.
My thoughts are whether we see a ‘Buy The Rumour, Sell The Fact’ setup today. Meaning if we DO get an additional stimulus we may not get the expected reaction because although, yes, that’s bullish, but the market may have already priced it in.
Dax Technical Analysis
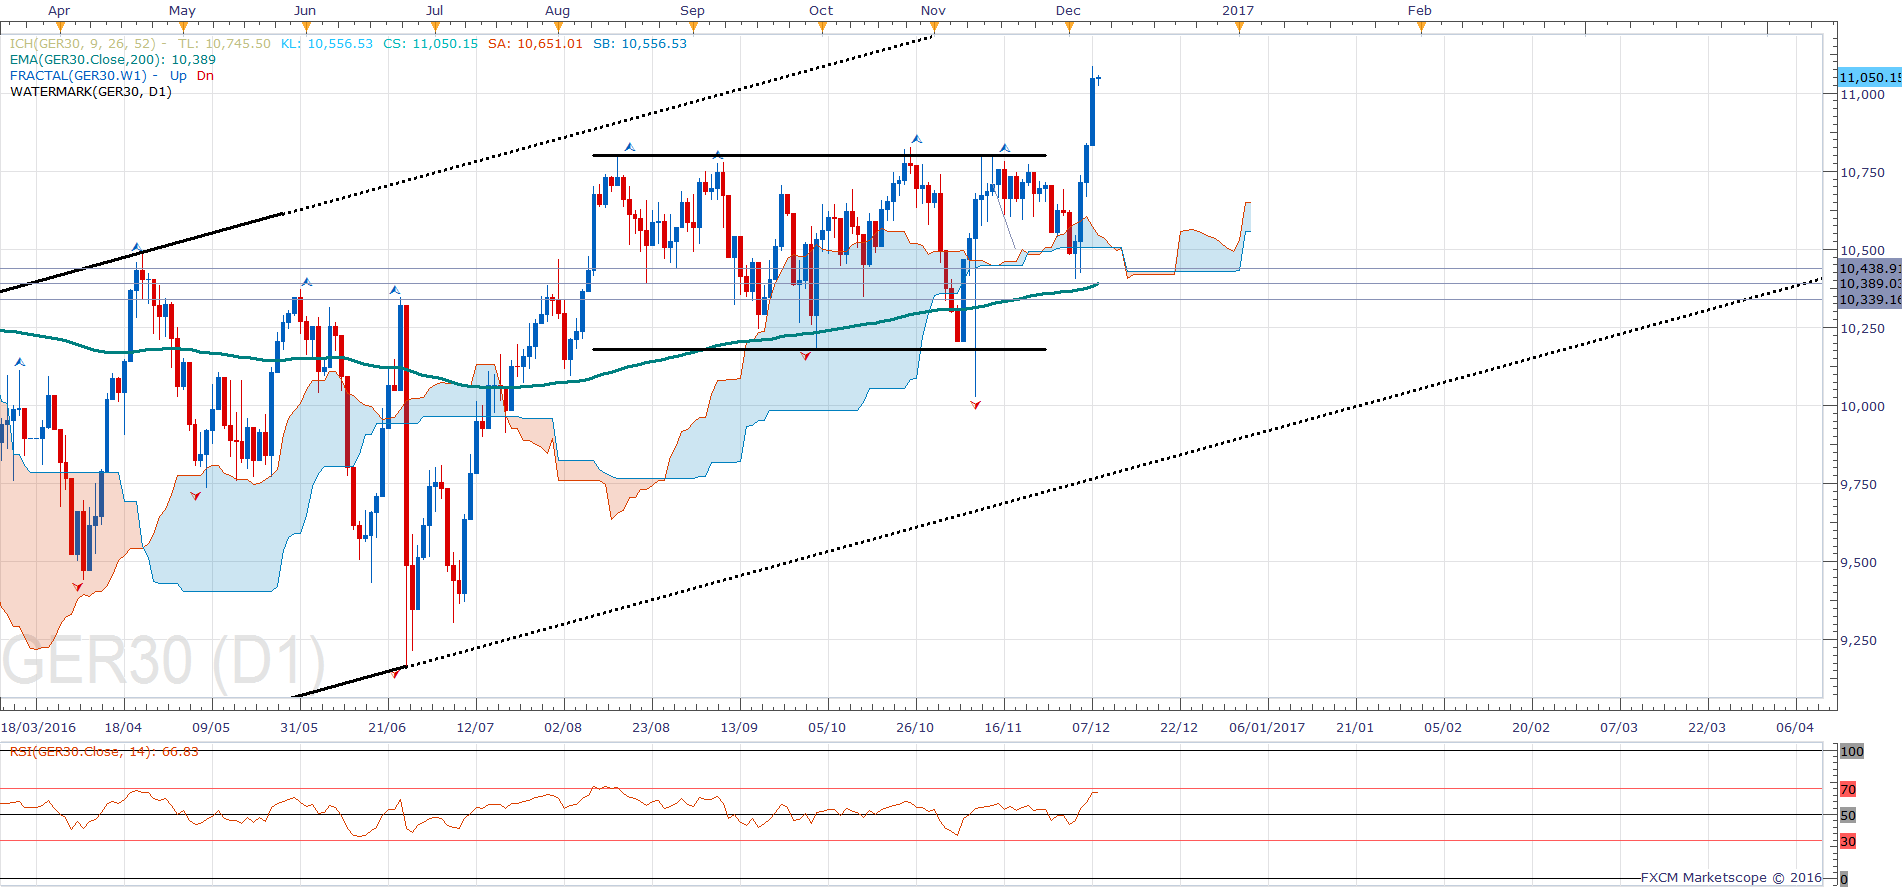
On the daily chart, this is a clear break out above 10830. We have rallied over 600 points without any correction and are over-bought. RSI suggests that there is still further room to move to the upside. But a healthy correction seems necessary at the moment.
On the H4 chart, price is hugging the upper Bollinger band. The oscillator is about to cross over in over bought territory and the pullback target is between 10 815 and 10 650.
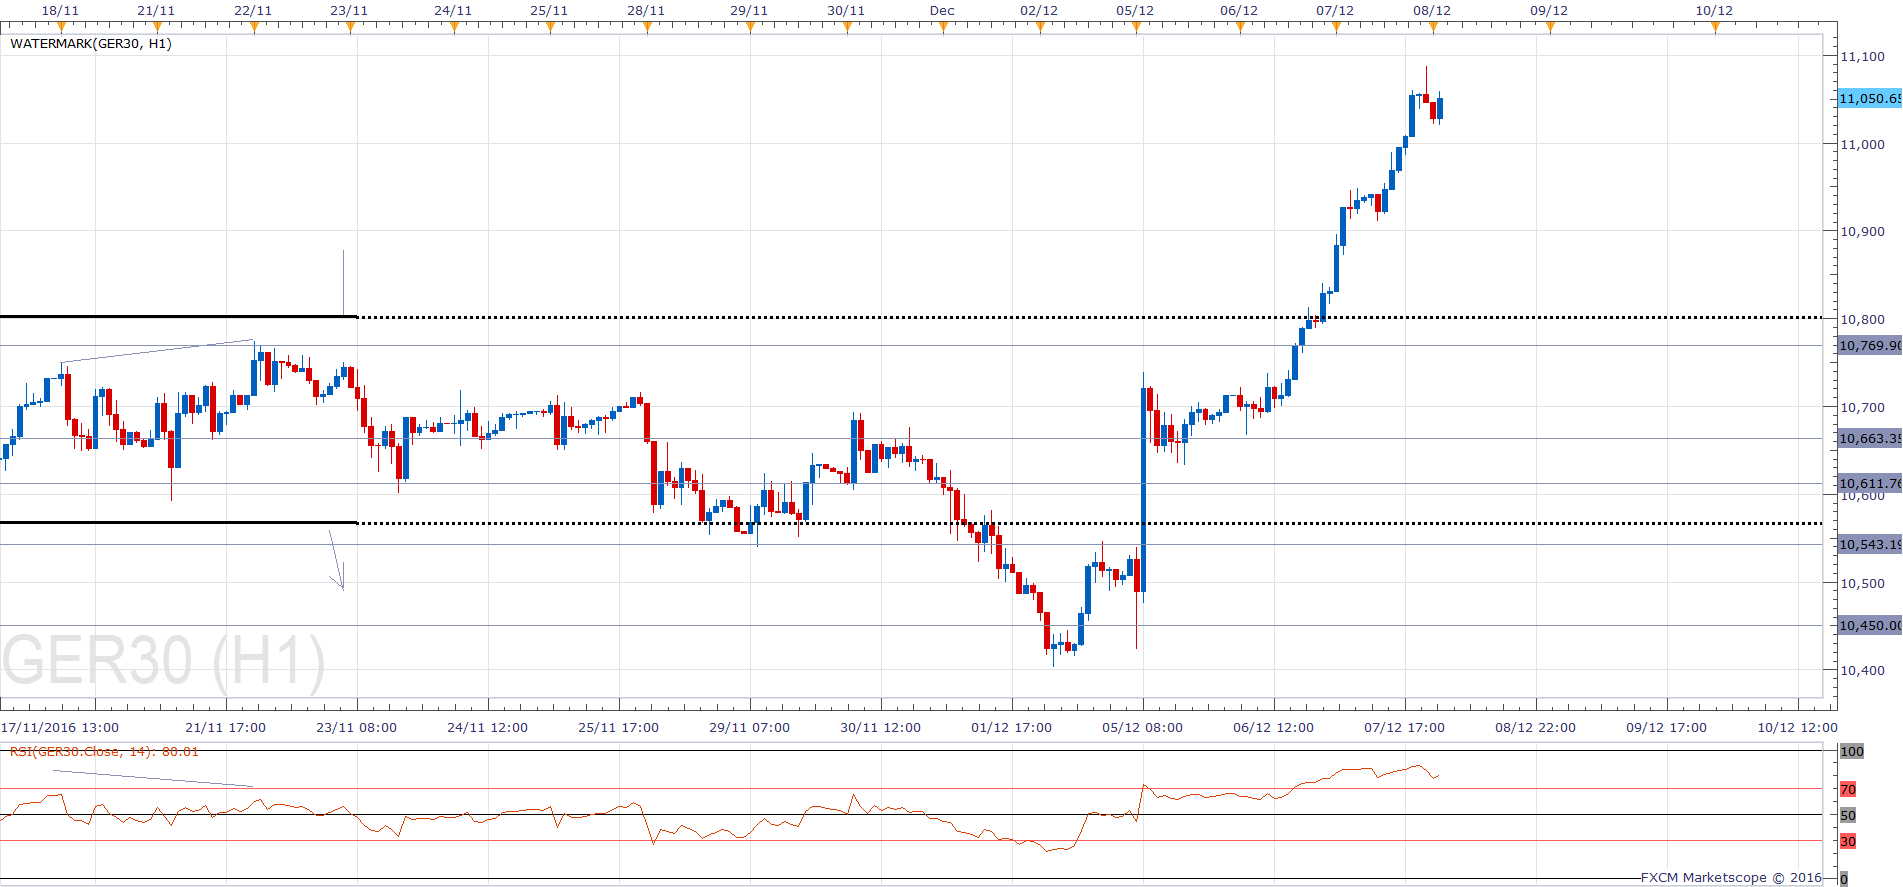
On the H1 chart, those who trade RSI would have been alerted to the bearish divergence that exists here. RSI is around 86, and we have created a double top on the oscillator while the price is making a higher high. Oscillator making a lower high and price making a higher high: this is a sell signal.
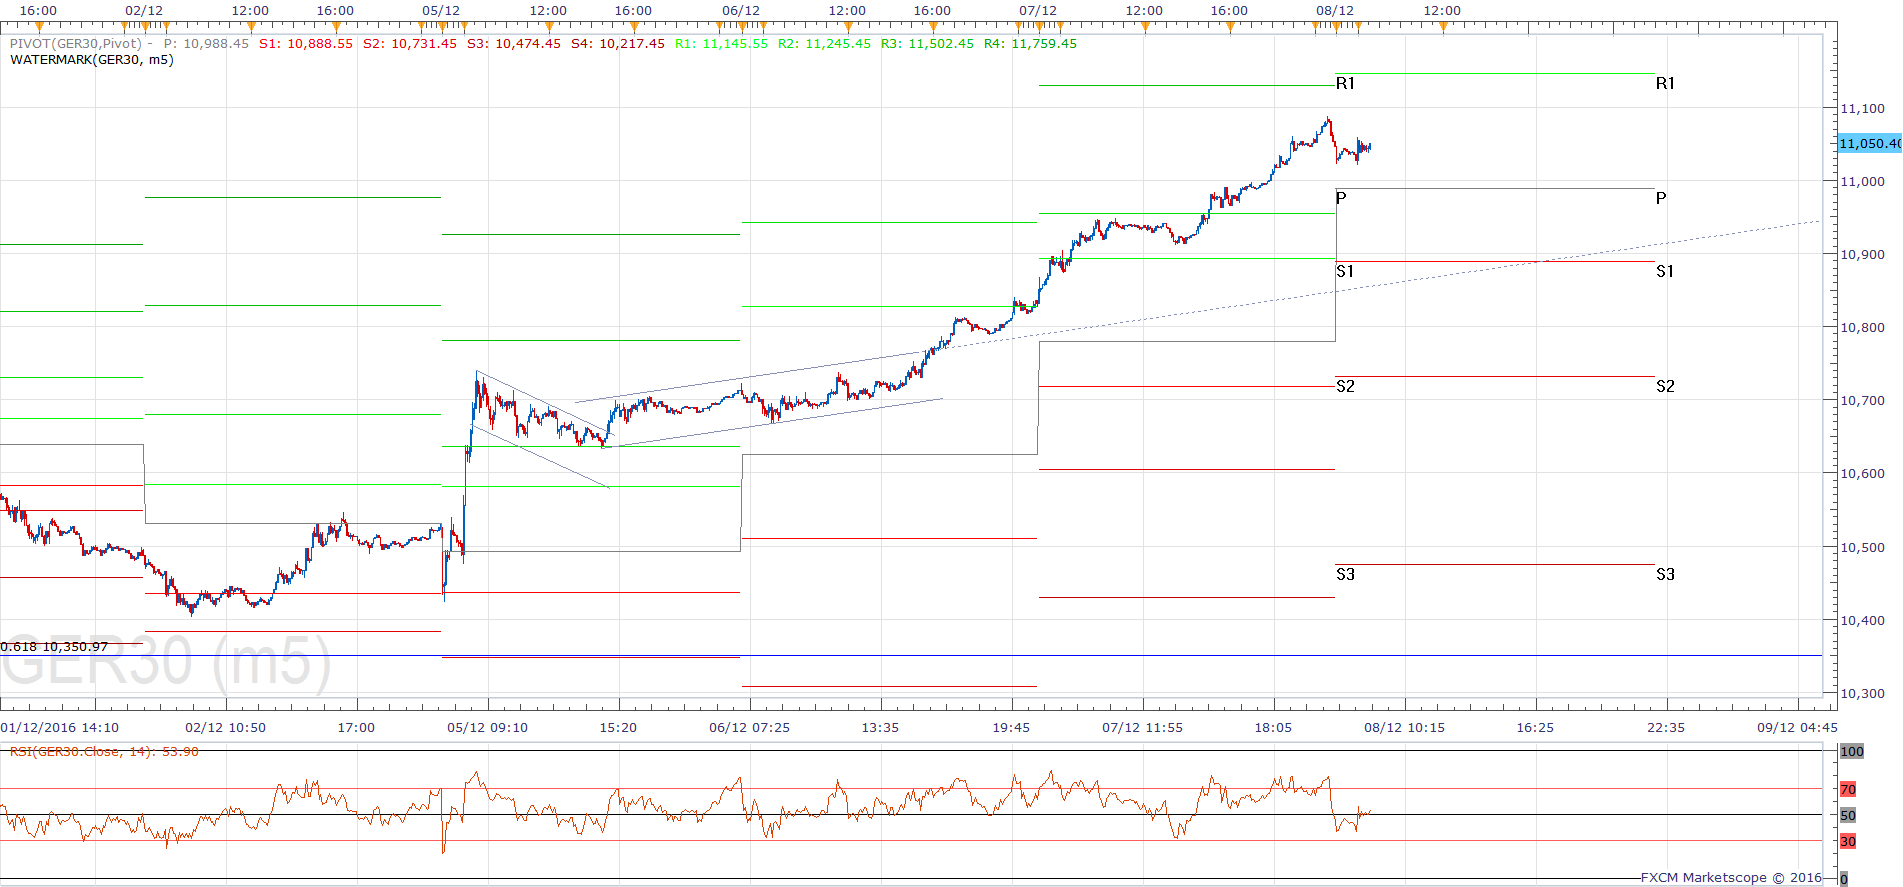
On the m5 chart, we have a textbook bullish uptrend and the trend defining level (short-term) is 10900. A shorting opportunity exists in current levels (11041) with a stop above the high 11,090 looking to target right back towards the daily pivot and daily S1.
I am personally not going to be selling this market because when the Dax is trending it tends to be relentless and going against the trend can often cause losses.
Dax Support & Resistance
| KEY LEVELS | |
| Daily R2 | 11245 |
| Daily R1 | 11145 |
| Daily Pivot | 10988 |
| Daily S1 | 10888 |
| Daily S2 | 10731 |
| 200 Day EMA | 10389 |
Dax Charts
05-dax-m5-chart
01-dax-daily-chart

02-dax-h4-chart
03-h1-dax-chart


