Hello, traders!
So the geopolitical soap opera, that is unfolding in North Korea, woke up the markets again as the ambassador to the UK said they will continue ballistic missile and nuclear programmes, while he added that they are ready to turn to ashes any available strategic assets of the US. Sounds promising…. [sarcasm]
As for yesterday, we made a small gain over the day: 0.35% (approx 44 points) and the price was contained within the body of the previous day’s candle, which was also contained within the previous day’s candle. Today we briefly broke higher, above the body of the candle from yesterday, but are still within the candle’s range. The bias on the daily chart remains bullish above 12000. You could argue that the trend defining level is actually 12400, and I would probably agree there is a case, but if price broke this level, I still feel that the trend is intact, just simply because the 28/4 low isn’t really a low in my opinion.
On the hourly chart, I have just noticed that the trend line has broken. I am not entirely sure whether this means anything at all, but I am thinking it’s possible that this could open up some selling pressure as traders look to book profits on their recent gains. One idea could be that price moves up to test the underside of the trend line if indeed this trend line has any significance at all, then after testing the underside of the trend line, price looks to reverse. That’s one idea. It would then justify the bearish divergence signal seen previously and conform to the normal market behaviour of a pullback. But the Dax isn’t a normal market.
On the 5 minute chart, the price has been trading in between the 38.2 – 61.8 Fibonacci zone from the retracement study drawn using the 5/5 high and the 8/5 low, we are actually currently (at the time of writing) trading at the 50% level. Today I think a break below the previous day’s low can open the door to 12650 and lower. A break above 12785 can open up a move to test 12830 again.
Get Dax Trading Signals
Come and receive live trading signals directly to your phone and join the community.
Three months of signals will cost £94 and can be purchased using this link: https://www.paypal.me/DaxTrader54/94 . To access the free broadcast channel on Telegram messenger, (additional Dax analysis and messages to my readers and subscribers) simply download the Telegram messenger (from www.telegram.org) and then click this link: https://t.me/joinchat/AAAAAEAypsW3Xet_6ngBlw
To receive live trading signals please complete your purchase using this link: https://www.paypal.me/DaxTrader54/94
Dax Support & Resistance
| KEY LEVELS | |
| Open | 12701 |
| High | 12784 |
| Low | 12701 |
| Close | 12745 |
| Range | 83 |
| Change | 0.35% |
| 14 Day ATR | 117.65 |
| Daily R2 | 12827 |
| Daily R1 | 12786 |
| Daily Pivot | 12744 |
| Daily S1 | 12703 |
| Daily S2 | 12660 |
| 200 Day EMA | 11423 |
Dax Charts
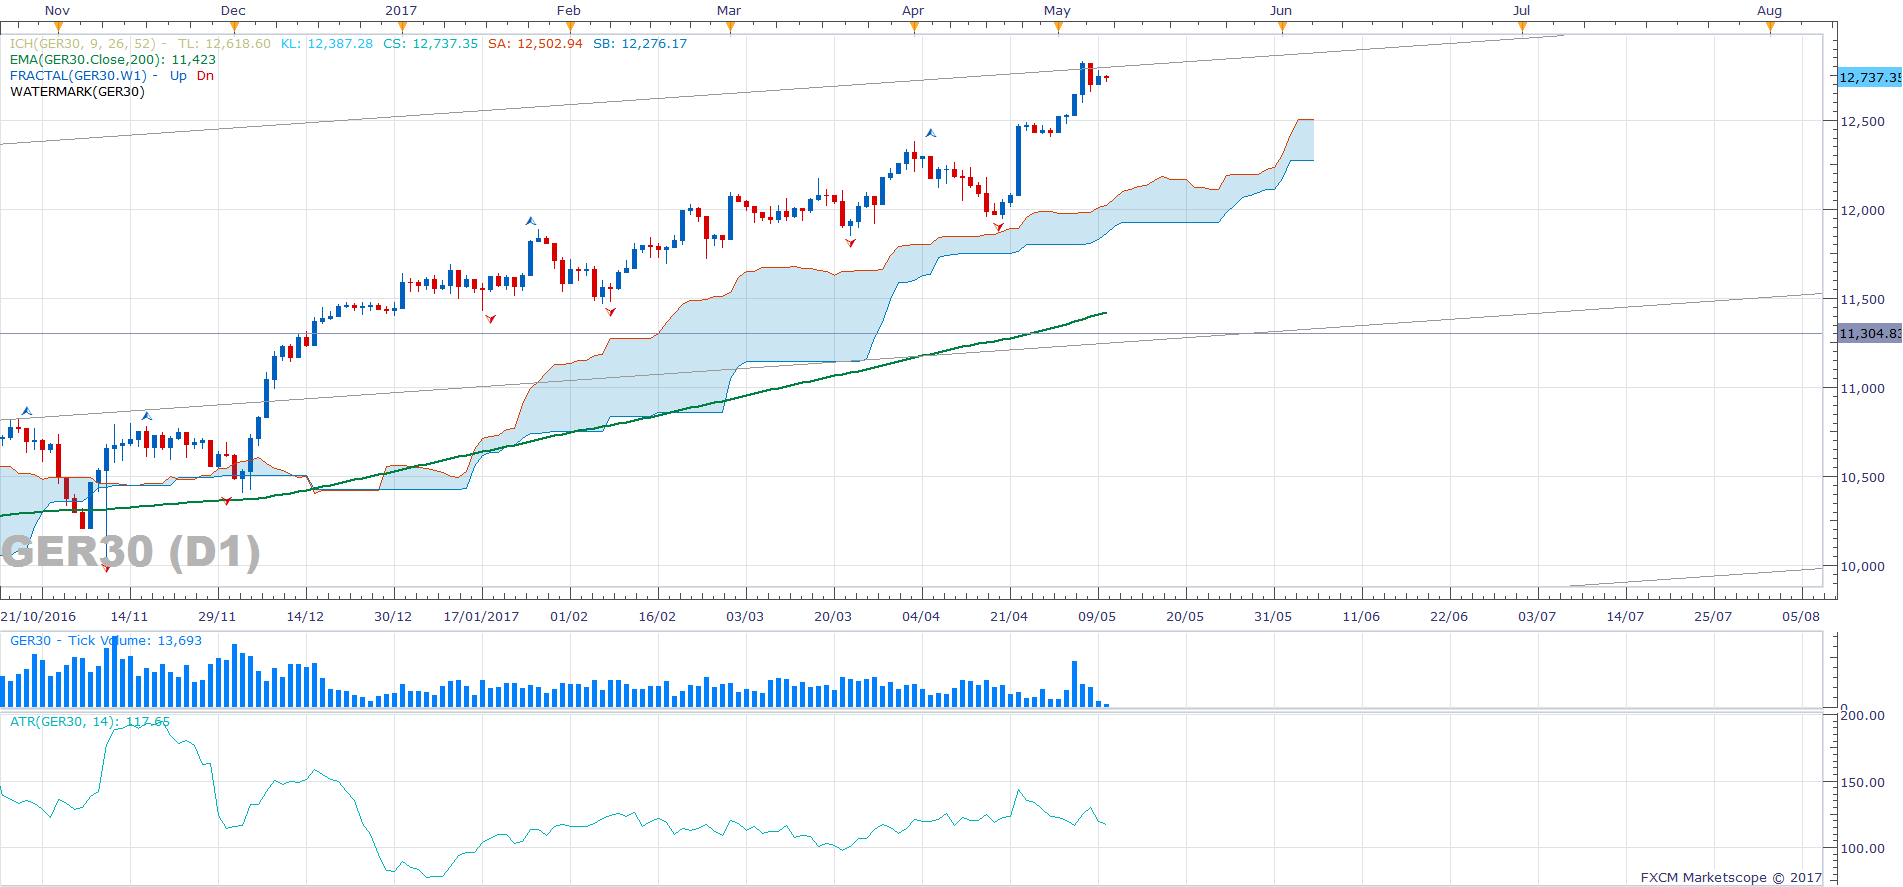
01 Dax Daily Chart

03 H1 Dax Chart

05 Dax m5 Chart


