Good morning traders!
ECB stole the headlines last week thanks to its decision to keep its money flow wide open, and the decision has left its mark. We are on our yearly highs similar to how we were last year.
Today however we are having a small break from the rally. Whether the rally continues may now depend on the Fed. Many analysts estimate that the central bank, chaired by Fed CEO Janet Yellen, will raise the benchmark interest rate a year after the interest rate reversal. An interest rate step is expected to rise from a quarter percent. In addition, the price of oil is also interesting for investors, given the agreement of OPEC to limit the flow rates as this increases the speculation of rising inflation.
Then we have Italy, who still have over one year left on the current mandate but the Prime Minister has resigned of his own will after a defeat in the referendum. The rejection of the reform proposals comes as a hit as many of Italian banks are in trouble, and are too big to fail, But also too big to save.
Dax Technical Analysis
11230 was an important target for many traders and I would imagine there was a lot of profit-taking to be had there. The Dax has rallied over 800 points in just over a week and the need for consolidation is high. If the rally does continue, then the next major target is 11 430.
On the daily chart, we are currently forming a bearish engulfing candle and if this is the start of the pullback/correction I suspect that traders will target the 10800-11000 zone. If the Santa rally continues then this will offer the bulls a great buying opportunity.
On the H4 chart, we have been riding the upper Bollinger band higher last week, with the oscillator remaining overbought for some time, a break below 11125 would be interesting as there is not a huge amount of volume below.
On the H1 chart, the rally is slowing and at this stage, the bearish divergence signals may be a little more reliable, but we are still short term bullish above 11125. At the time of writing, we have just printed a hammer, which could suggest a rejection of this pullback, so let’s see how that develops.
On the m5 chart, we had an interesting opening candle, one with a higher high and a lower low, this may have trapped a number of bulls who were looking to get long early in the session, only to be found in a nasty position as the price dropped 100 points. We are currently below the daily S1 (pivot point indicator) and are currently bouncing from the Friday low. A break below this could open up 11125 and lower.
Dax Support & Resistance
| KEY LEVELS | |
| Daily R2 | 11300 |
| Daily R1 | 11265 |
| Daily Pivot | 11205 |
| Daily S1 | 11171 |
| Daily S2 | 11111 |
| 200 Day EMA | 10406 |
Dax Charts
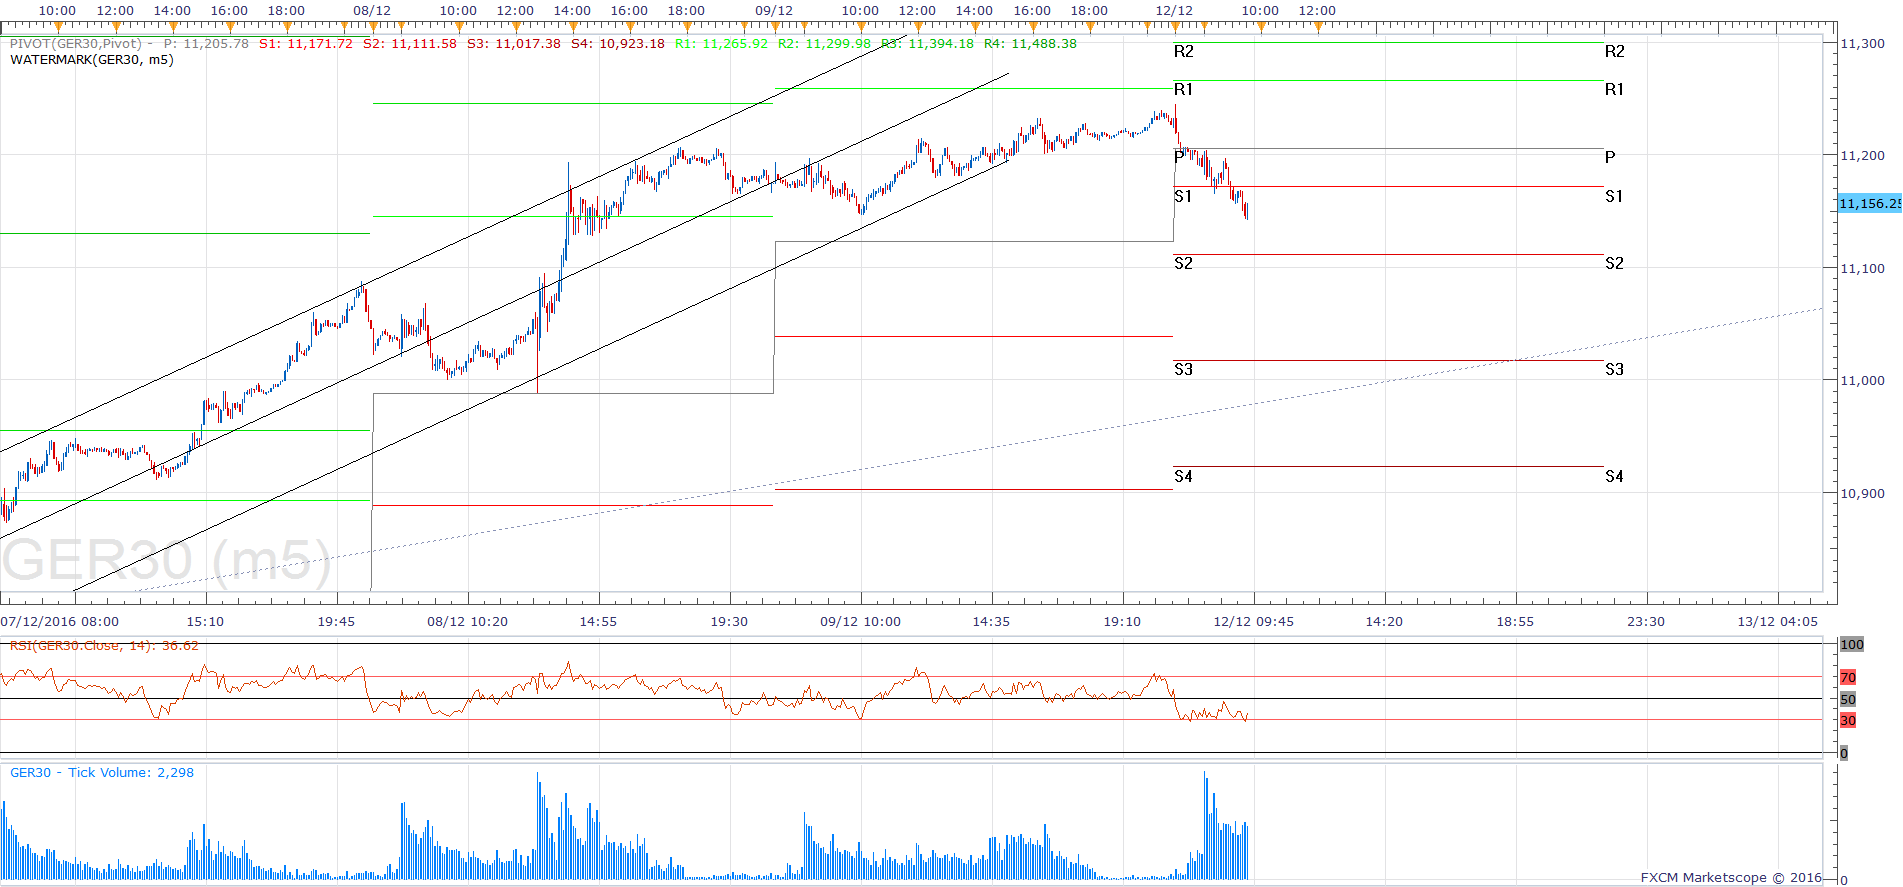
05-dax-m5-chart
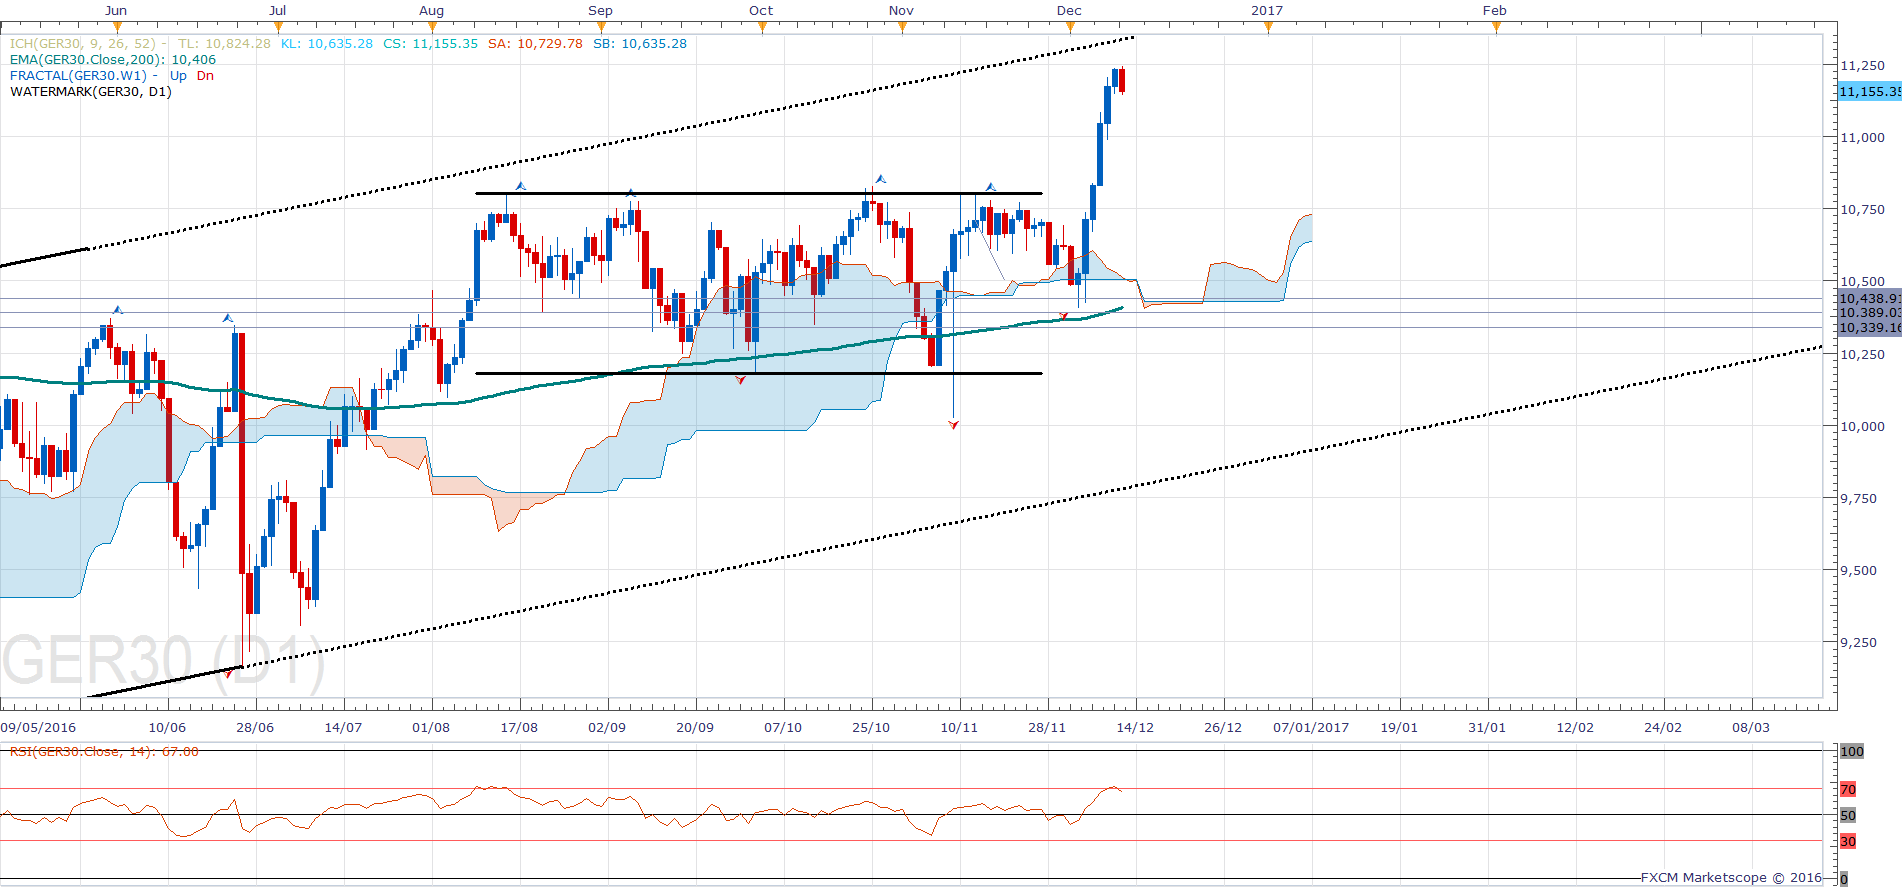
01-dax-daily-chart
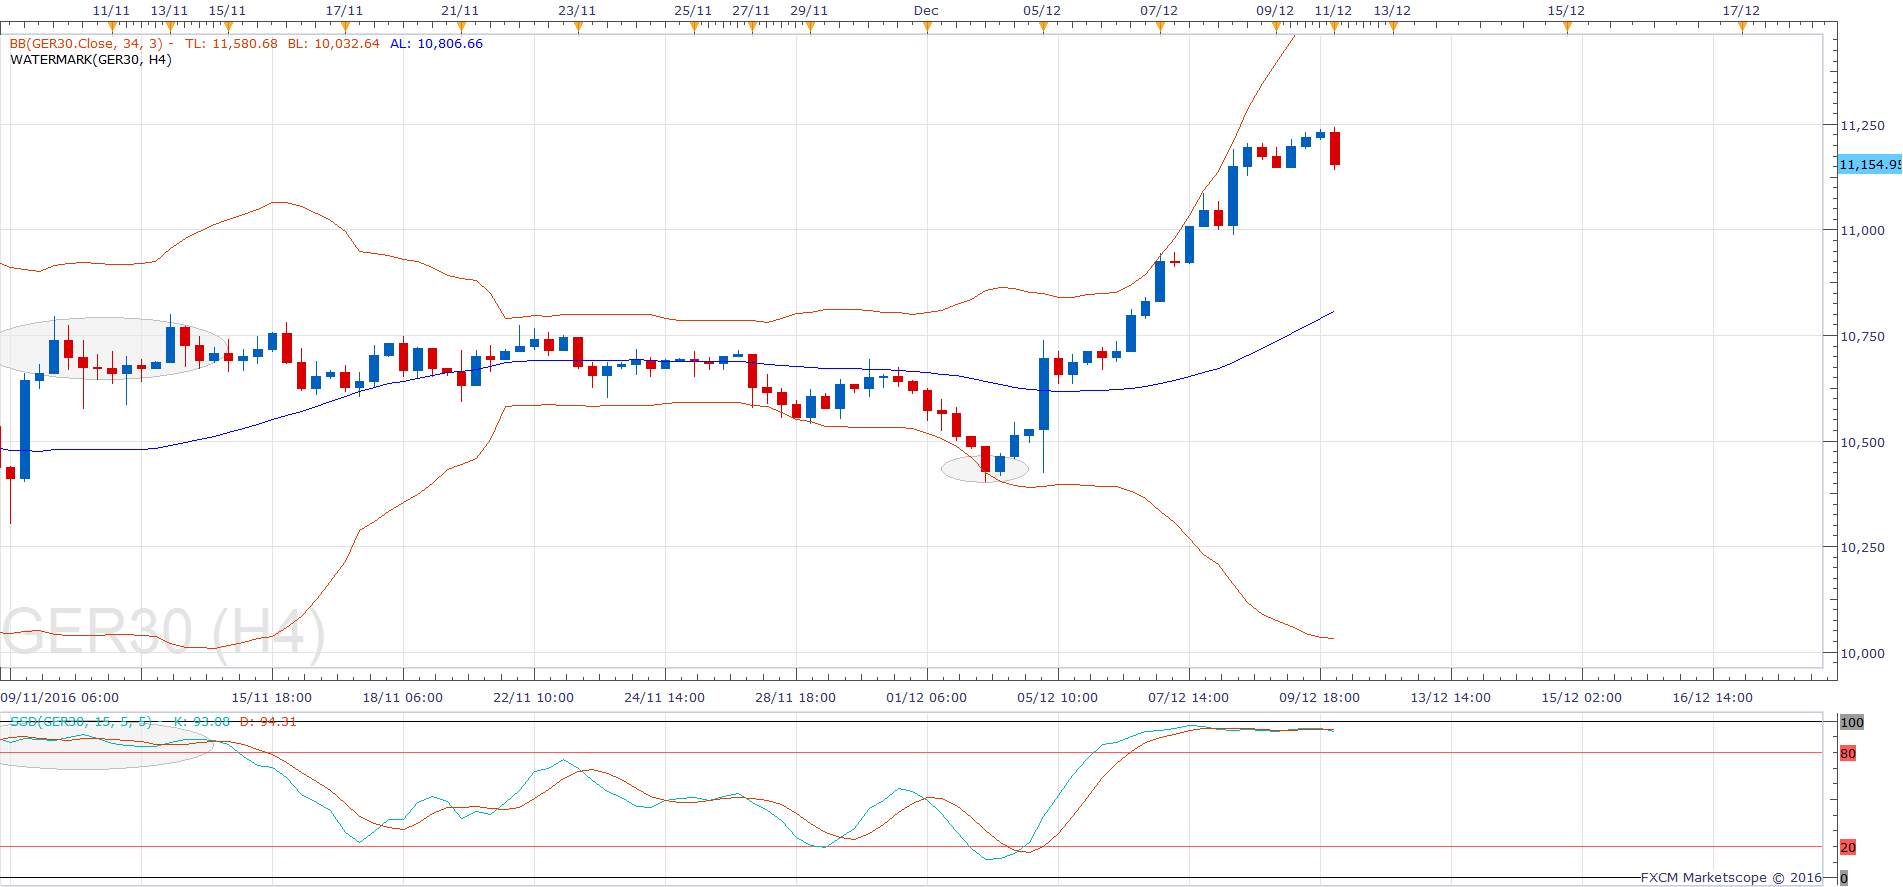
02-dax-h4-chart
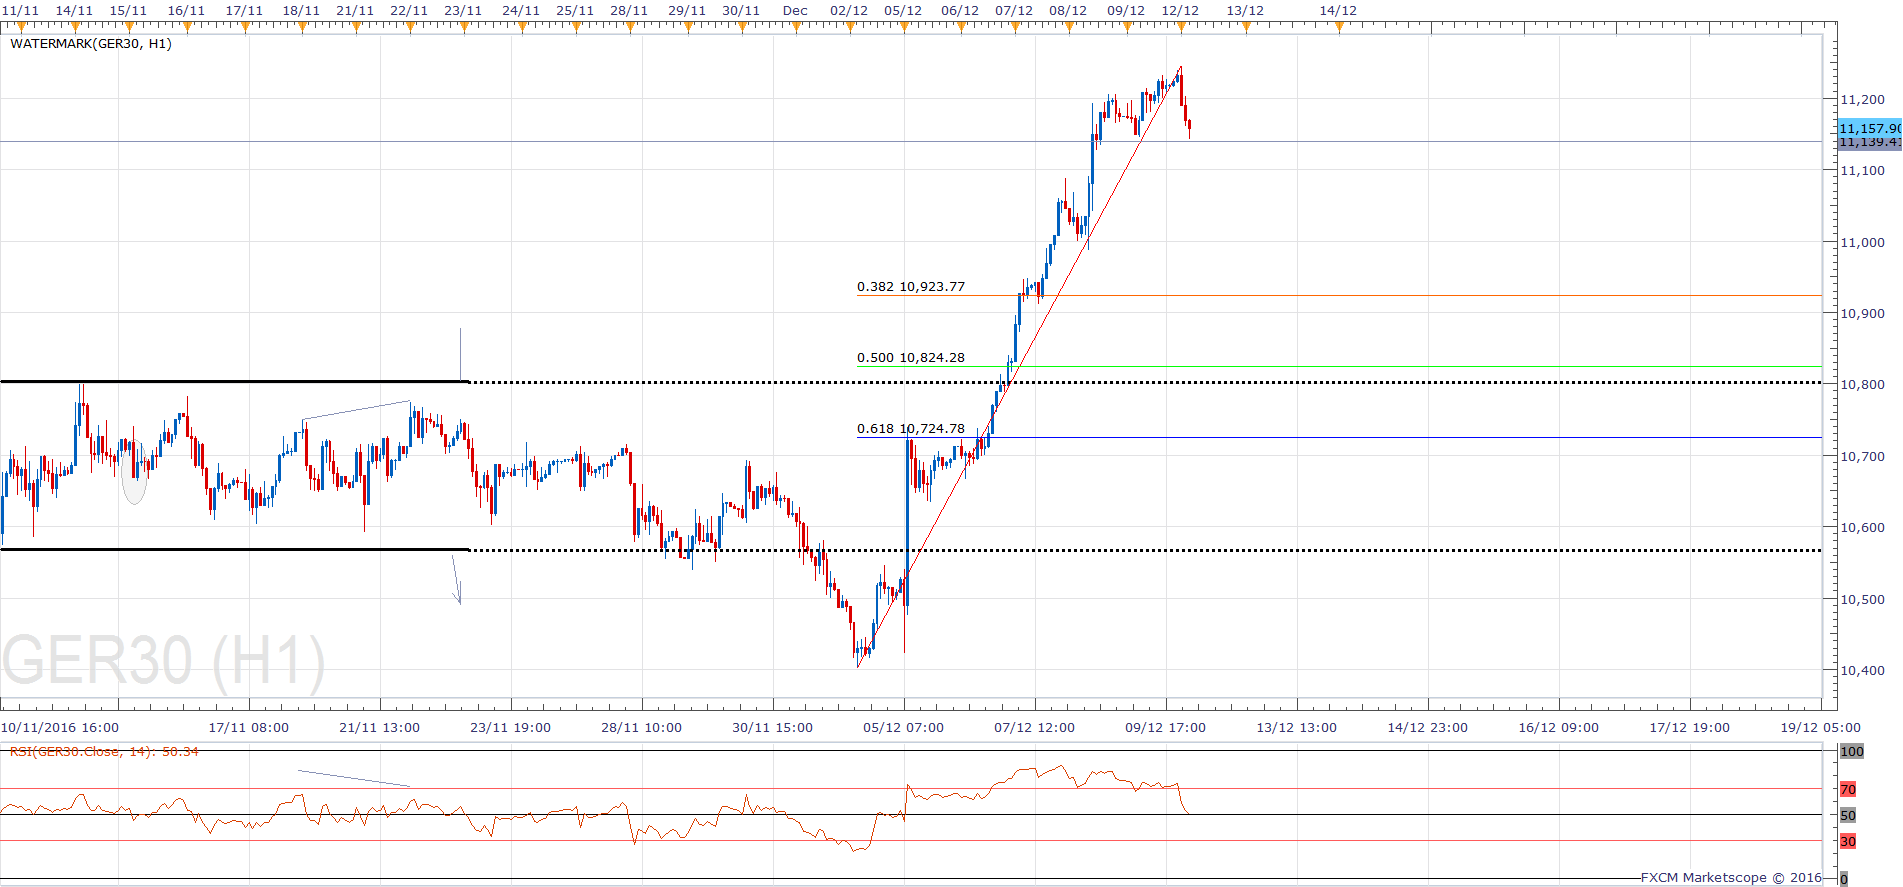
03-h1-dax-chart


