Good morning traders!
I spent the majority of yesterday putting the finishing touches to my upgraded algorithm and putting my mql4 experience into action. I have been taking a couple of pretty intensive courses over the past two weeks which has opened up a wormhole of additional courses I could take regarding OOP, C++, PHP, app development and web development. All very interesting to me. Anyway, I digress.
I figured I will be making many of the scripts, indicators and expert advisors available on the website soon, so if you are interested in that, come send me a message on Telegram. Regarding trading signals, I now see an uplift in the volume of signals for premium members, as I am looking to extend the Dax signals to SPX and FTSE as well. Gold members also have an upgraded signal channel on the way, so subscribers will benefit from these changes.
Yesterday, Frankfurt and London markets saw fresh highs primarily down to Oil prices rallying, China announcing a significant infrastructure spending plan and of course the upbeat news regarding the German election. Oil prices gained on the back of news from Saudi Arabia and Russia stating they could extend production cuts into 2018. As two of the largest oil producing nations, that news was substantial. Merkel seems to be winning support in the largest German city, which is pleasing markets, so the ‘stars are lining’ up for further bullish activity on the stock markets, despite the overbought conditions.
The daily chart shows a piercing to new highs yesterday with the 200 EMA lifting to one of the steeper angles we have seen in recent months/years. Price remains strongly bullish at the moment, even though the ATR is dropping. Watch for a break above 12835, perhaps be aware of the potential for a rejection as traders begin to take profits. If I was to predict a movement, it would be a rejection of the break above 12835, bears will expect the price to fall to 12500, but instead, price reverses and continue higher. The double fakeout would be my prediction. See the hourly chart.
On the 15 minute chart, a potential pullback zone is marked out with the Fibonacci study. The Parabolic SAR is printing support around 12725, so I am bullish above that level and a retracement to the Fibonacci levels provides a half decent reward to risk opportunity. Yesterday morning I missed two opportunities:
The first opportunity was a break above the Bollinger band and touching the daily R2. It would have been difficult to call a short-term ‘reversal’ here, so hindsight is 20/20. The other opportunity which was much more compelling was the bullish divergence at the daily S1. Lower low on price (marked out with the fractals – the hourly fractals) higher low on the oscillator (Stochastic).
Dax Trading Signals
Come and receive live trading signals directly to your phone and join the community.
Three months of signals will cost £94 and can be purchased using this link: https://www.paypal.me/DaxTrader54/94 . To access the free broadcast channel on Telegram messenger, (additional Dax analysis and messages to my readers and subscribers) simply download the Telegram messenger (from www.telegram.org) and then click this link: https://t.me/joinchat/AAAAAEAypsW3Xet_6ngBlw
To receive live trading signals please complete your purchase using this link: https://www.paypal.me/DaxTrader54/94
Dax Support & Resistance
| KEY LEVELS | |
| Open | 12813 |
| High | 12840 |
| Low | 12723 |
| Close | 12806 |
| Range | 117 |
| Change | -0.05% |
| 14 Day TR | 98.21 |
| 200 Day EMA | 11463 |
| Daily R2 | 12907 |
| Daily R1 | 12857 |
| Daily Pivot | 1279 |
| Daily S1 | 12740 |
| Daily S2 | 12673 |
Dax Charts

03 H1 Dax Chart

03 m15 Dax Chart
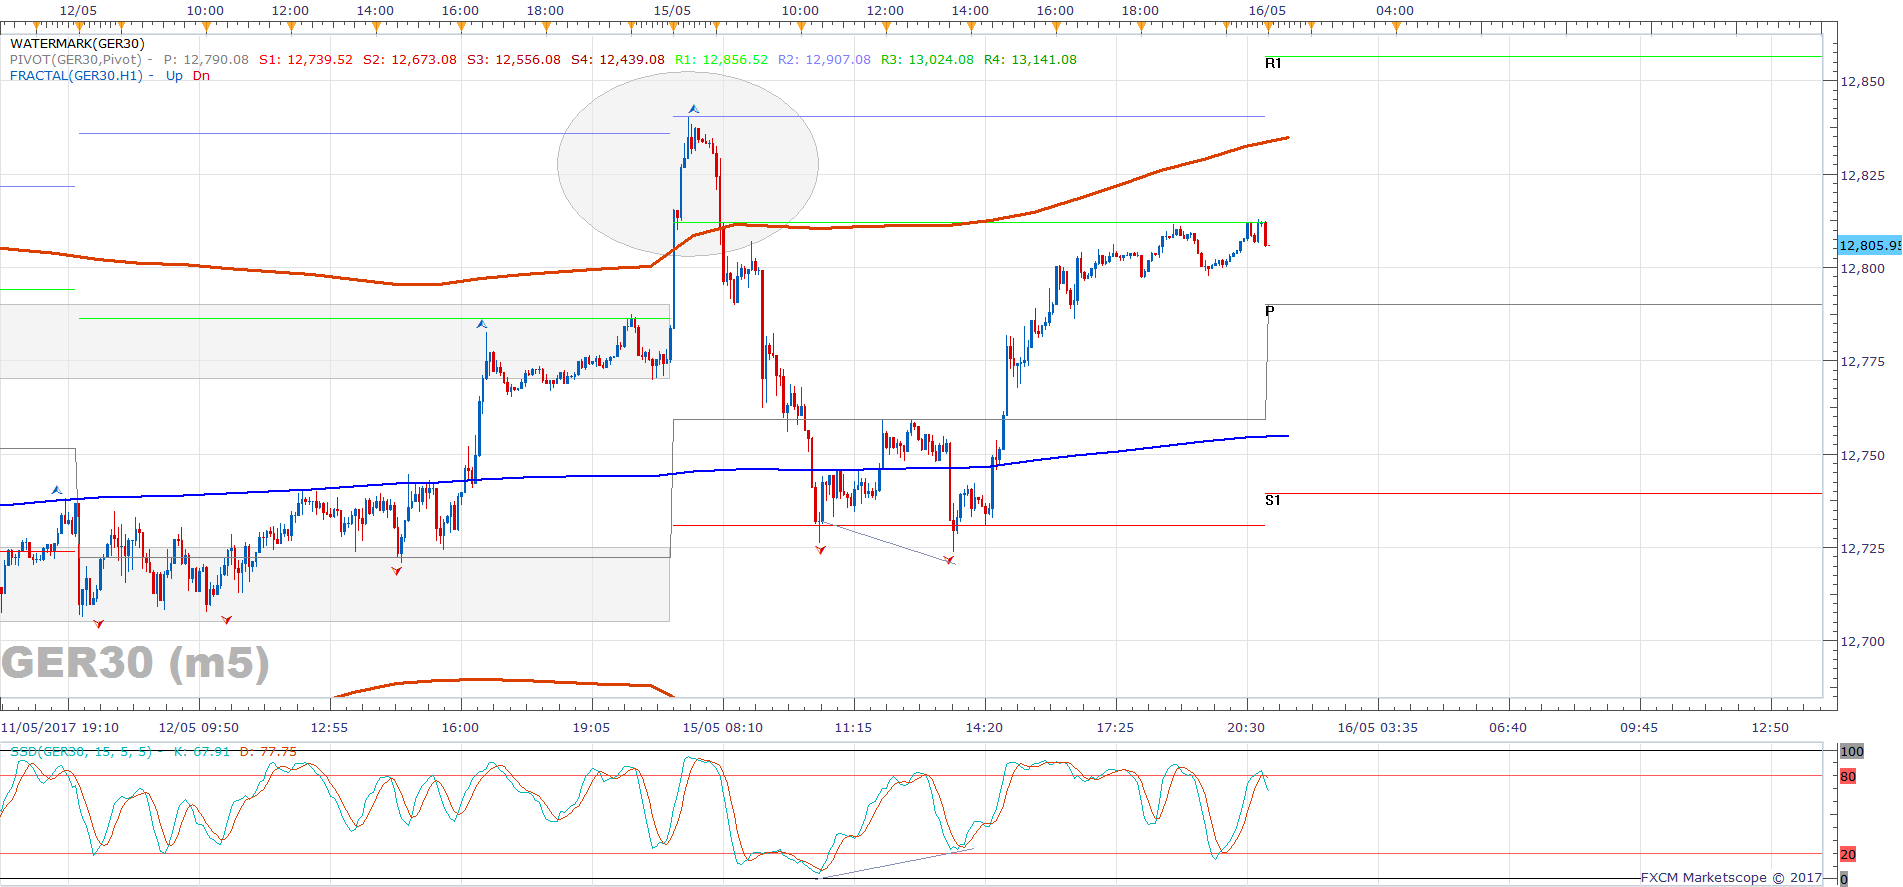
05 Dax m5 Chart

01 Dax Daily Chart


