[info]Have you spotted the new Live Chat feature that I installed last week?[/info]
Good morning traders!
Since the US election, analysts have turned their focus to the reflation theme particularly for the US. With Trump elected eyes now turn to inflation and whether ‘real inflation’ (continued rise of inflation) will present itself. It is regarded that the reflation theme will be more prevalent in the US, rather than Europe. The fundamental picture will focus on economic recovery, closing the output gap, rising commodity prices and central bank monetary policy.
Today is the week of thanks giving in US (Thursday I believe) and the market is closed today, so it’s unlikely that we see any real volume in the market later today, although historically the week of thanksgiving tends to be bullish.
I am looking for a buy entry around 10660, if price can get there.
Dax Technical Analysis
This morning we opened up +25 points higher, tested 10700 and was rejected around 8am GMT. The rejection could have been a bull trap, as many traders initially jumped on the rally first thing. If the gap closes then there is a possible buying opportunity because price will be approaching the support from last week.
The daily chart is still showing the threat of a pullback, which I have been banging on about for the last week or so and it is still yet to happen. But the chart is failing to break resistance and is looking like it’s peaked temporarily. Watch for a break below 10580 or a break above 10830.
The H4 chart shows a similar picture to the daily. The pullback target is clearer on this chart, which would now be the collinger band low and inside the Fibonacci retracement zone. We saw a bit of divergence between price and the oscillator last week, but price failed to make any progress lower.
On the hourly chart, price is trapped inside the wedge formation and traders are waiting for a break one way or the other. We are currently (at the time of writing) forming an engulfing candle but found some short term support at 10661, just above my entry of 10660.
On the 30 minute, I have marked out a buy zone between 10400-10480 which I suspect many traders are looking for, this stays the same from last week. There are a few support levels to take out before we get there including 10650, 10600, 10580 and the pivot levels below.
On the 5 minute chart I have been marking out divergences and at the moment there is a bit of hidden bullish divergence suggesting price can move higher. I plotted a simple H1 moving average (2 periods – median) over price to give an indication of trend and price is short term bullish above 10645 , this opens up a trade opportunity.
If you are looking for Dax Trading signals, come and find out more about Premium Dax Trader Signals here.
Dax Support & Resistance
| KEY LEVELS | |
| Daily R2 | 10788 |
| Daily R1 | 10725 |
| Daily Pivot | 10686 |
| Daily S1 | 10623 |
| Daily S2 | 10585 |
| 200 Day EMA | 10343 |
Dax Charts
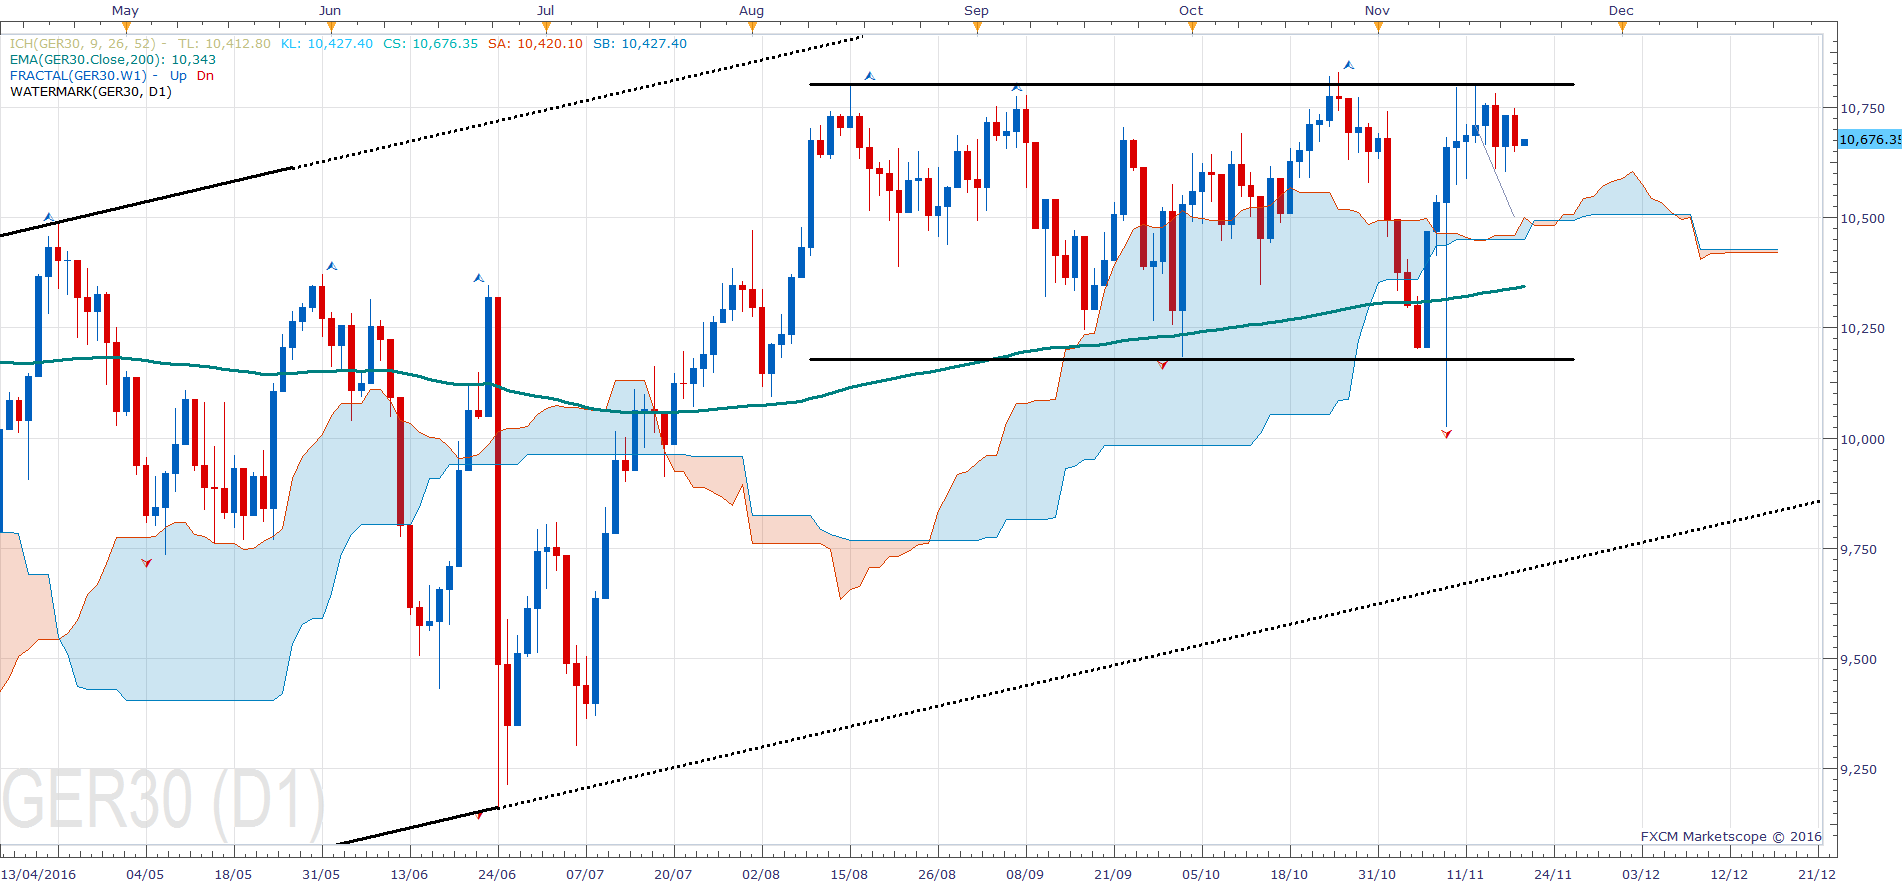
01-dax-daily-chart

02-dax-h4-chart

03-h1-dax-chart

04-dax-m30-chart

05-dax-m5-chart


