European markets shake off Syriza win in Greece, despite the Euro tumbling to further losses, which highlights the influence of the ECB asset purchase program. The Syriza has decided on their bed partner (right-wing anti-austerity party) and can now commence with working on their policies. Despite the surge in markets today, the Greece concerns are only temporarily quelled with volatility still present due to an uneasy fear of a Greece default on their bailout debt and being shown the door, bringing the recently forgotten doomsters back to the market.
Dax Support & Resistance Levels
[wp_ad_camp_1]
| KEY LEVELS | Difference | |
| Daily R2 | 11030 | 204 |
| Daily R1 | 10933 | 208 |
| Value High | 10770 | 97 |
| Daily Pivot | 10759 | 154 |
| Naked VPOC | 10730 | 81 |
| 24hr VWAP | 10716 | 107 |
| 34 Hour EMA | 10666 | 151 |
| Daily S1 | 10662 | 158 |
| Value Low | 10601 | 18 |
| Daily S2 | 10488 | 104 |
| 200 Day EMA | 9571 | 13 |
Dax Technicals
[wp_ad_camp_1]
Daily Chart
(Below)
Dax is currently at the top of Oct/Dec rising trend channel for only the second time, very close to the 100% fib extension and on the back of a 1400 point rally in three weeks. The RSI is 78 and we have had five solid bull days, back to back, but the trend shows no real sign of reversing any time soon. For bulls, there is plenty of short-term resistance with 10959 being the 100% fibonacci extension and 10853 being yesterday’s high. Making another all time high early in tomorrow’s session opens up door to breaking out of the rising channel and reaching close to 11k.

Dax Daily Chart
[wp_ad_camp_1]
Intra-day
Using a bollinger band of 34,3 is actually working out to be a half decent strategy in this current bull market because when price reaches the lower band, it is providing an excellent entry to go long. Utilising stop losses should prevent giving back too many gains on correction/reversal. Confluence exists between the R1 and the 100% fib extension adding to the resistance overhead, but there is momentum to the current rally. A break under the pivot of 10756 opens up 10662 (S1) and 10488 (S2) providing the recent cluster of support at 10600 fails to hold.

Dax Intra-day Chart
[wp_ad_camp_1]
Volume Profile
There are many fractured pockets on the way down to yesterdays value area high of 10770, so if I was bearish I might look to short a break under 10800 targeting 10770 and 10730, or as a bull I might look to go long from between 10755-10770.
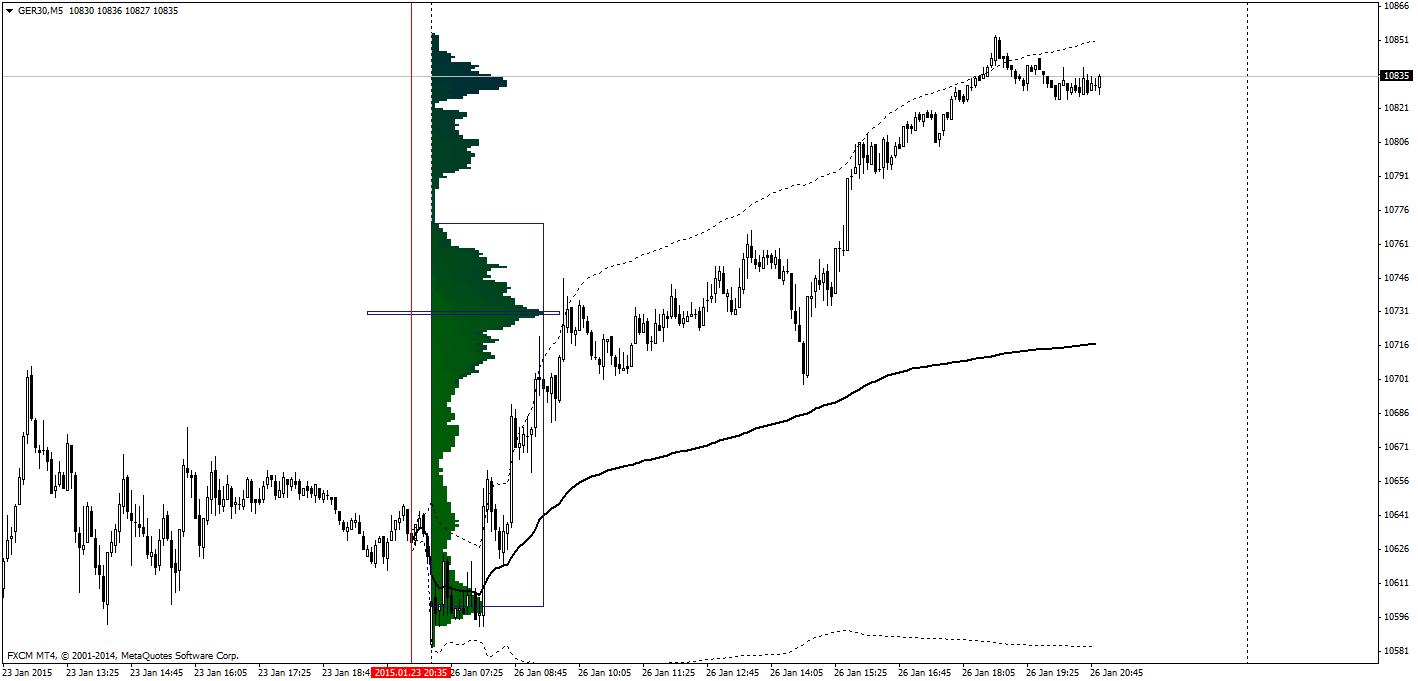
Dax Volume Profile Chart
[wp_ad_camp_1]


