Good morning traders!
Check the economic calendar today, as there are plenty of high impact events on the agenda.
Is the Dax starting a Bearish Evening Star?
 The Dax strengthens again, barely. But most interesting to me is the potential evening star candlestick pattern that is emerging. This is typically a three candle pattern, that requires some confirmation from all three candles, but speculators and retail traders will often anticipate the move after two candles.
Wednesday we had a decent bullish candle after a bullish breakout from the recent range, this created a higher high. Yesterday we gapped higher when the market opened, then created yet another high but closed very close to the opening price, above the gap, creating a doji/inverted hammer candle. If we gap lower on open today, it could be a very interesting day for bears.
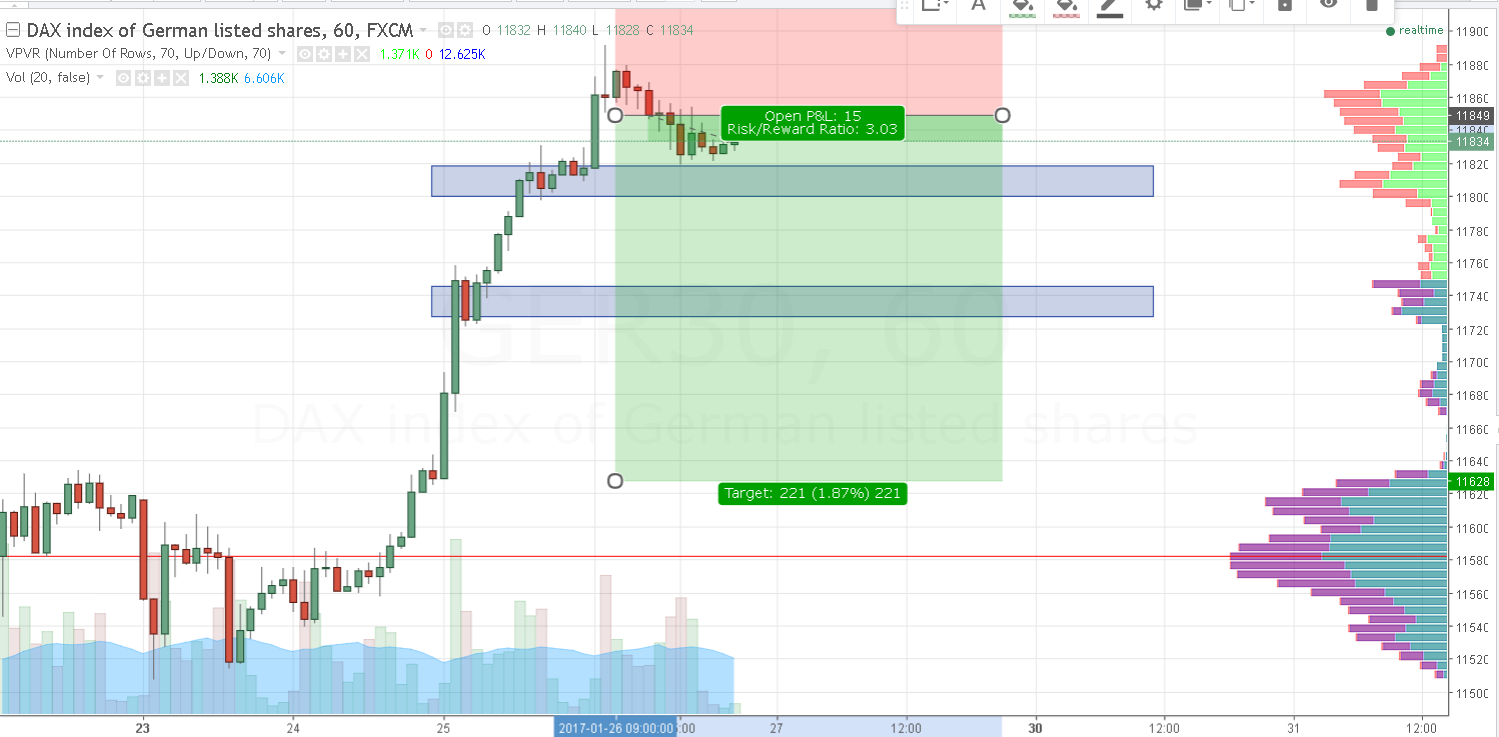
Yesterday I posted this setup on TradingView, not an actual trade, just an idea to sell around 11850 targeting 11630 stop loss around 11930. I would be keen to see that play out. But as we have discovered, all too often, with uncertainty high, interest rates low and sentiment heavily bearish, a maniac president talking up the markets, prices have the right conditions to continue to rally. But the technicals are suggesting a signal. 3:1 reward to risk with that.
04 Dax m15 Chart
Dax Technical Analysis
Daily Chart
200 EMA: 11719
Stretched long
Bullish continuation breakout with strong momentum, but showing an inverted hammer after making higher high, currently trading around 2015 resistance and looking to target 12,000 and possibly all time highs again. With the US markets running molten hot at the moment, the Dax will likely look to keep pace. 11630 was solid resistance previously and should provide some support from above.

01 Dax Daily Chart
Hourly Chart
Using a Fib retracement on the rally from the recent range low, to the recent high, gives bears a couple of targets for their shorts, if that plays out. I think buyers will be interested in stepping in around 11680, should price fall that far, I also suspect that 11750 could be a turbulent zone as the 38.2% is a popular Dax level when momentum is high.
RSI seems a little unusual, coming back to normal levels with barely a correction on the recent spike. Keep an eye out for bearish divergence (will happen if price makes another higher high and RSI makes a lower high) for a stronger signal.

03 H1 Dax Chart
Dax Support & Resistance
| KEY LEVELS | |
| Daily R2 | 11922 |
| Daily R1 | 11877 |
| Daily Pivot | 11847 |
| Daily S1 | 11803 |
| Daily S2 | 11773 |


