Hello traders!
Still fairly uneventful at the moment, not a lot to report on. I have not traded this week on the Dax as the opportunities have not really been available. I was half expecting there to be a pullback to give some of the recent gains back, but it has not happened and investors are seemingly becoming more and more encouraged with European equities right now.
We are still above the 12400 previous resistance, so I am keen to watch this level for any reaction. When we look at the hourly chart, the oscillator (RSI) has come back to normal levels and is actually underneath 50, although price remains very high, providing excellent conditions for the development of a bearish divergence signal. The problem I see with 12400 is that it doesn’t really represent a significant pullback from the moves we have seen, so the level may not hold. But the longer price continues to trade sideways, the stronger that level could become.
It was another compressed day yesterday, relative to the recent breakout, with price trading in between the daily S1 and R1, settling at the lows of the day for a second bearish candle on the daily chart. Today, price is also moving slowly, below the daily pivot, but apparently catching its breath. The Bollinger band line has climbed up to meet price and the oscillator is also rising whilst price decreases, which I believe is hidden bearish divergence. So the technical signs are not really supporting a buying position just yet, even though the Dax often can, without warning, discard technical patterns and just do what it wants to.
I am still not in any position, completely neutral and waiting for an opportunity to enter.
Dax Support & Resistance
| KEY LEVELS | |
| Daily R2 | 12507 |
| Daily R1 | 12469 |
| Daily Pivot | 12447 |
| Daily S1 | 12408 |
| Daily S2 | 12386 |
| 200 Day EMA | 11324 |
Dax Charts
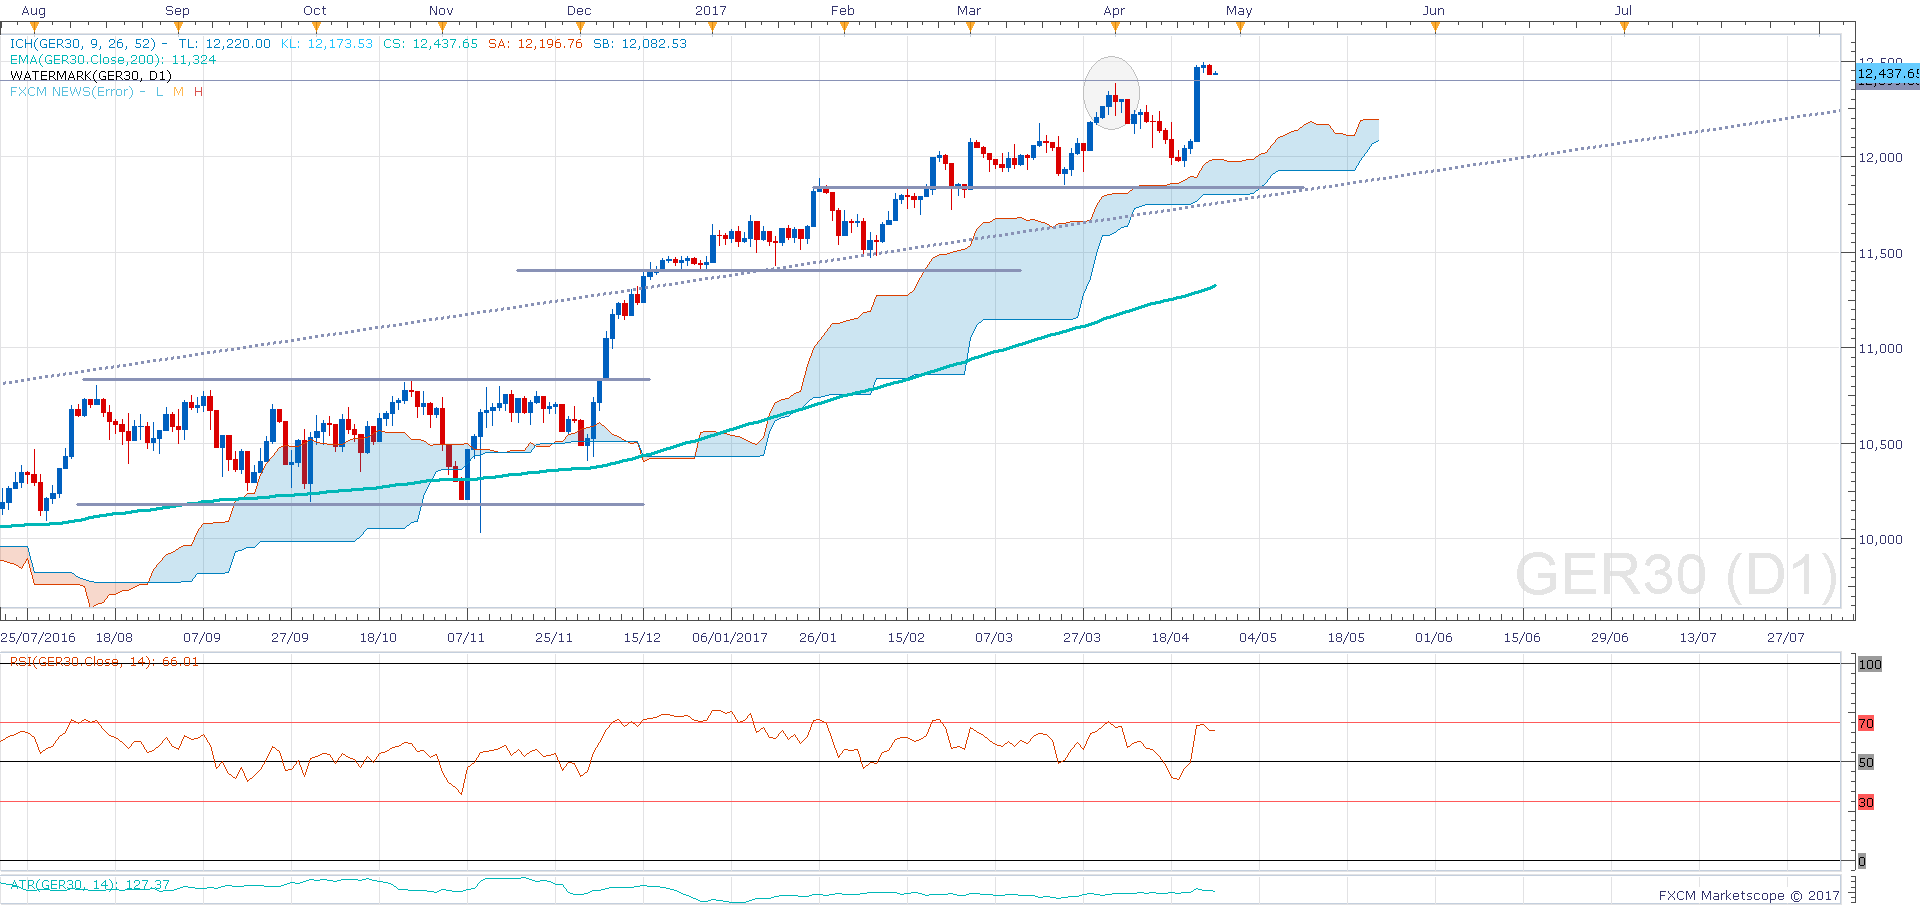
01 Dax Daily Chart
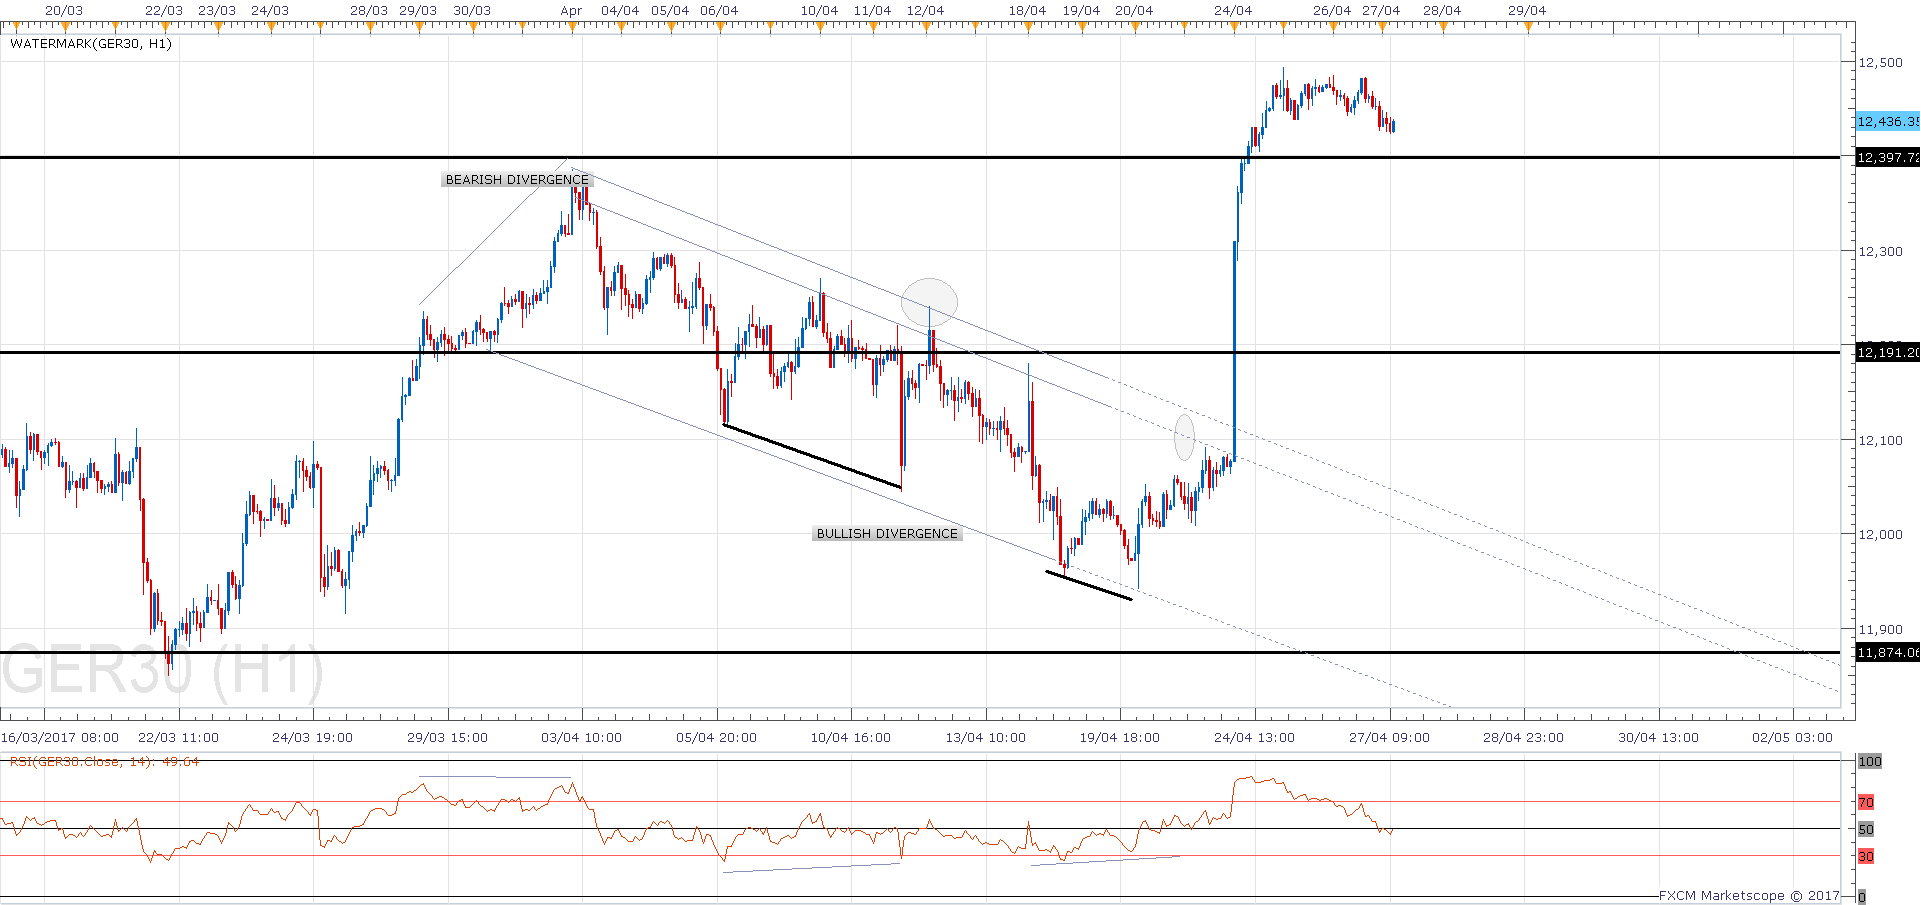
03 H1 Dax Chart

05 Dax m5 Chart


