Good morning traders!
We may have gapped slightly higher this morning, but we have been unable to take out yesterday’s high just yet and we are also finding resistance at the 50% fib from 23/3 – 27/03 swing.
Bears would look at current price and think it’s a good opportunity to go short, perhaps a better option is to wait for a rally to 10k and then trade another rejection. Technically, that could make a lot of sense, especially with the daily R1 being around there as well.
Bulls would be looking at the recent trend and be continuing to trade it until it breaks. We found a double bottom yesterday around 9800 and have rallied over 100 points since them. The trend defining level, short term, is 9875. A good opportunity might be a wait for a move back towards the daily pivot and trade from there with a stop loss under the 9850 targeting a break of the high from yesterday.
The daily chart is still looking heavy as we approach multiple resistance levels, but this could just also just be a waiting area for price to build the platform for a further big rally back towards 10500+. On the 4-hour chart, looking back to 29/01, we are currently sitting on or around the price of previous resistance I wonder if we are looking to use that as support now. The hourly chart is still, barely, holding on to the parallel as support. We have been trapped between parallels 1 and 2 for a while, so a breakout from either could be interesting. On the 30 minute chart, bullish momentum is beginning to pick up but the Stochastic suggests overbought, nothing conclusive.
DaxTrader RSI EA
We are getting buying signals from the DaxTrader system at the moment, so I am going to follow them.
Update: Version 3 is still being tested. Thank you to those who have downloaded the trial and provided your feedback. There are a couple of bugs that still need ironing out, so lots of long nights of coding are still required before I can properly release it. It’s with regret that I will delay the release date.
The signs are really very encouraging, the trade results from back testing are looking fantastic, like triple digit growth fantastic, so I need to make sure all the T’s are crossed and the I’s dotted (as much as I can). Please bear with me.
Note to self: give yourself a month to test the software!

Trade
Dax Support & Resistance
| KEY LEVELS | |
| Daily R2 | 10044 |
| Daily R1 | 9986 |
| Daily Pivot | 9896 |
| Daily S1 | 9839 |
| Daily S2 | 9749 |
| 200 Day EMA | 10217 |
Dax Charts

06 m5 Dax Chart

05 m30 Dax Chart
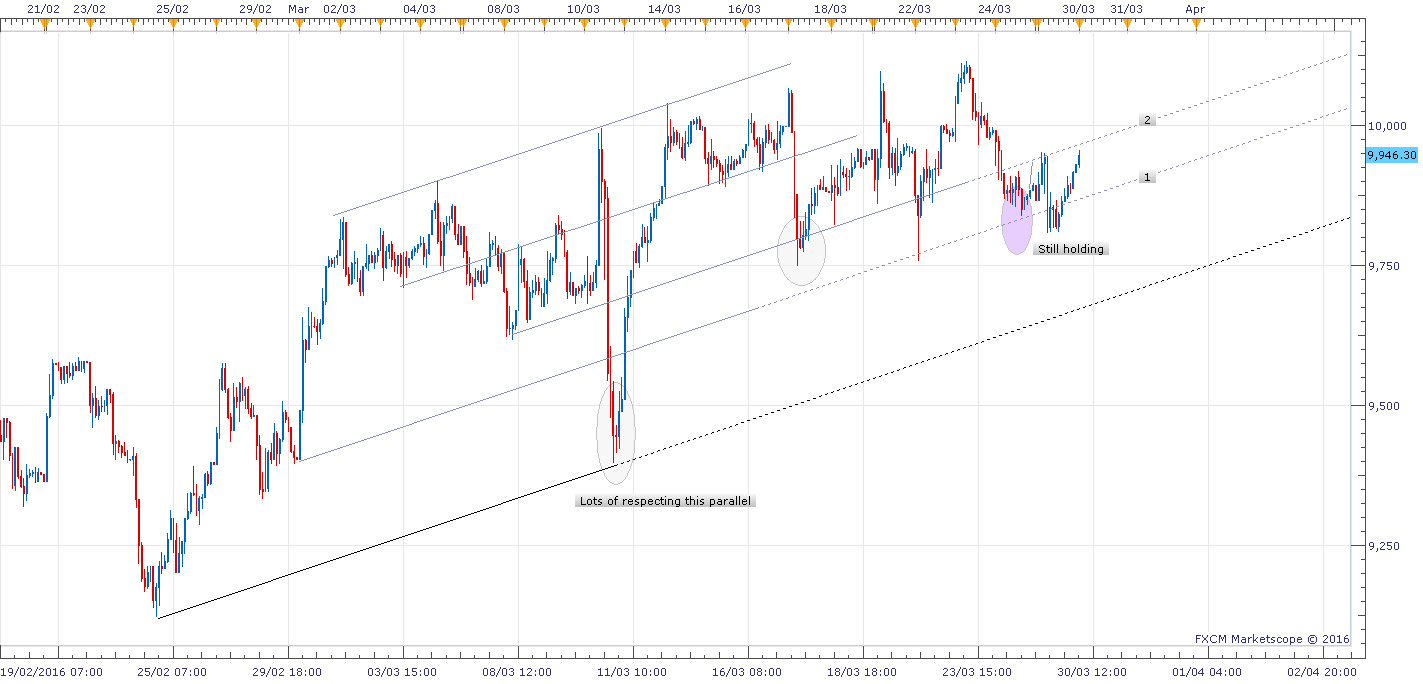
04 H1 Dax Chart

03 H4 Dax Chart

02 Daily Dax Chart


