The DAX Bollinger band is a technical indicator that uses a combination of simple moving averages and a standard deviation channel. This helps us compare volatility and price levels over time. John Bollinger is the creator of the tool and this is a Bollinger band introduction.
The Bollinger band is a visual reference to help us identify where the price is either high or low. Price is high at the top of a Bollinger band and low at the bottom of a Bollinger band. The bands may not be a standalone indicator. For example, if price touches a band, it is not always necessarily a signal. This is because when a market is trending, the price has a tendency to “walk-up” or “walk-down” the bands.
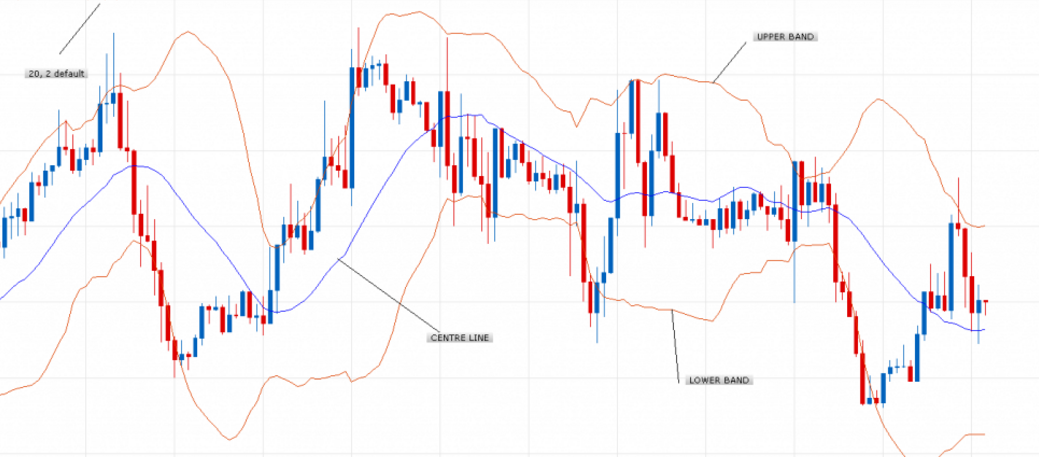
Most standard charting packages have the Bollinger band indicator included as standard. The default settings are 20, 2. These represent the moving average period (20) and the channel is the number of standard deviations from that moving average (2). The numbers can be changed by you, so you can increase or decrease both numbers.
Many use the indicator to identify “the squeeze” or “the pinch” which can be a good trading opportunity. The indicator can be used on any market, on any time frame and is very simple to learn.
The Basics of using the DAX Bollinger Band
Once you identify a trend, you can look for opportunities when price touches the bands. For example, in a German DAX downtrend, you are looking for times when the price has touched the top band. In an uptrend you are looking for times when the price has touched the bottom band.
John Bollinger – the creator – produced a guide to trading with the Bollinger Band. He mentions that price can, and does, walk up the upper band and down the lower band in a trending market. This is always a concern for traders who believe that price will reverse when the price touches the bands. So you have to be careful when entering trades on a ‘Bollinger band touch’ When using this indicator to trade, protective stops are essential.
Boring Statistical Technical Stuff
The other point to mention is a statistical point, more specifically a point regarding standard deviation as a technical analysis tool. At this stage, as you are considering your role in the trading community, I will assume you have a statistical/numerical brain. Maybe you already understand a little bit about standard deviations and statistics.

(The following is assuming data is distributed normally)
If a statistical model, such as a trading indicator, uses a single standard deviation of 1, it normally captures around 68% of the data within those limits. So if you selected a DAX Bollinger band that uses a standard deviation of 1, then the band should capture around 68% of price action within the bands.
If a statistical model uses a single standard deviation of 2, it normally captures around 95% of the data within those limits. So if you selected a Bollinger band that uses a standard deviation of 2, then the band should capture around 95% of the data within the bands.
The summary is that most of the time, the price will be contained within a 2-standard deviation DAX Bollinger Band, so only unusual circumstances will mean prices close outside of the bands. Therefore, when that happens it can provide a great trading opportunity because, statistically, it’s unusual. So now the boring bit is over.
Walking and Pinching of the DAX Bollinger Bands

We know that when markets are trending, they have the tendency to walk the bands (see the charts below). Walking the bands can suck a trader into a trade setup, thinking that there is an opportunity for a reversal, only for the price to continue moving in the same direction. Whilst this happens and price continues to walk the bands, the bands are getting wider and wider apart. So as each candle closes, it is tricky to spot the end of the move. At times like this, it can be easier to just get out of the trade or let the protective stop loss close you out.

On the other hand though, sometimes you will find the German DAX price action get to a point where nothing much is really happening. Perhaps liquidity in the market has dried up and there is not much trading activity or volume. Maybe the price just has zero volatility and goes quiet. In these cases, you will witness the “pinch” of the bands.
The DAX Bollinger Bands come in from either side to tuck price into a much smaller trading range. This process can be very useful for use because it easily shows the range of price action. It also offers an opportunity to “trade a break out” of that range. In either direction.

Trading with the Bollinger Bands
To Sell
- Identify a market that is in a strong downtrend.
- Wait for a touching or piercing of the upper band – suggesting that price is unusually high
- Wait for a candle to close within the band and then enter a sell trade on the open of that next candle.
- You want to wait for the confirmation that price is within the band, which is why you should wait until the candle closes.
- Place a protective stop loss above the recent high.
- Calculate how many points you have had to risk from the stop loss.
- Double that number and place a profit target that many pips away.
- You want at least a 2:1 reward to risk ratio.

To Buy
These are similar to the sell conditions.
- Identify a market that is in a strong uptrend.
- Wait for a touching or piercing of the lower band
- Wait for the next candle to close within the band and then enter a buy trade as the new candle opens.
- Place a protective stop loss below the recent low, just in case price decides to walk down the band.
- Calculate how many pips you have had to risk from the stop loss.
- Double that number and place a profit target that many pips away.
- You want at least a 2:1 reward to risk ratio.

Advanced Bollinger Band Strategy
Instead of using the default settings on the DAX Bollinger Band, which is normally 20, 2, you can experiment with different settings to find ones that suit you. So as an example, let’s say you wish to trade the USDJPY pair, and you normally trade the daily or H4 chart, you may want to use the normal 20, 2 settings as they provide you with enough control. However if you are more of a short term trader and use a 15 minute chart or 5 minute chart for example, then you may find the price action is noisier than the H4 or daily chart. So try using 3 standard deviations instead of 2, or try using a higher period moving average, like 34.
If you like to use the macro time frames like the 1 minute, you may wish to use both a 34, 3 setting. This will help to smooth out some of the noise.
