This unit will look at a similar chart pattern which is known as the triangle pattern, or for our purposes the DAX triangle pattern. Towards the end of the article, we will look at strategies that you can use to trade the triangle pattern on the Dax.
The triangle pattern can be broken down into three categories.
- The ascending DAX triangle pattern
- The descending DAX triangle pattern
- The symmetrical DAX triangle pattern
The shape of the triangle is significant, but of more importance is the direction that the market moves when the price breaks out of the triangle pattern. The last point to make is that while the triangle pattern can sometimes be a reversal pattern, they are normally seen as continuation patterns. This unit is only looking at the continuation aspect.
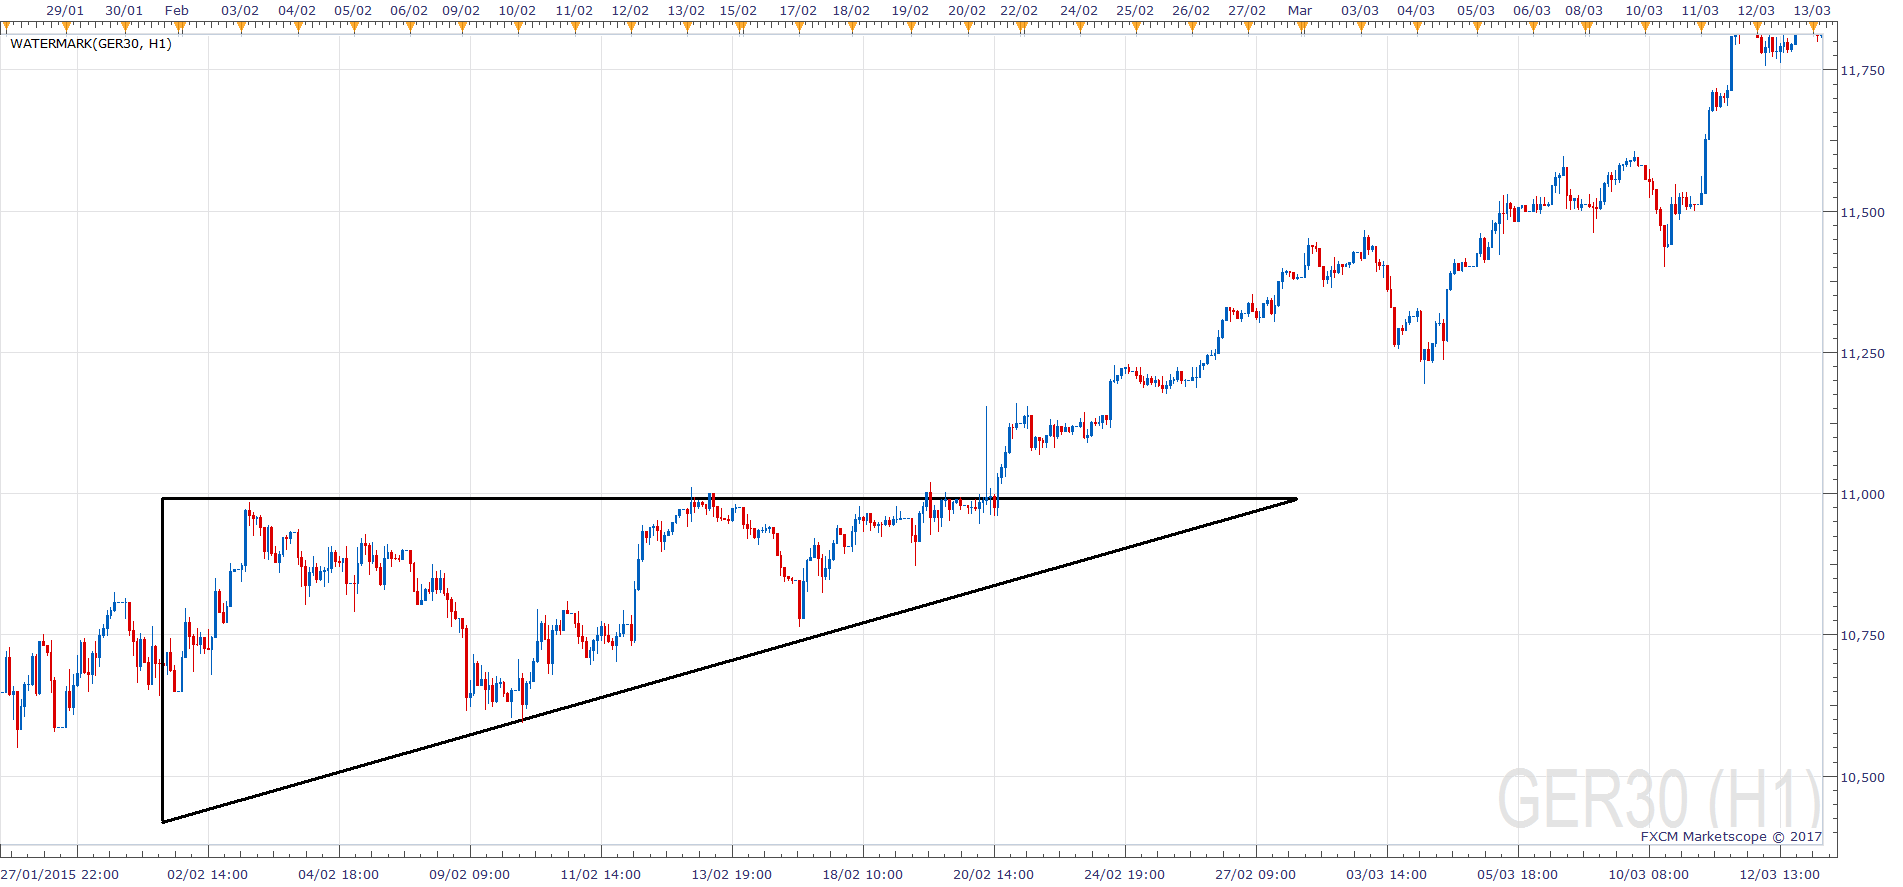
Ascending DAX Triangle Pattern
The ascending triangle is formed when the market makes higher lows but keeps the same level highs. So it’s a horizontal resistance, but rising support. This is normally seen in an uptrend and viewed as a continuation pattern. This is because the Bulls gain more and more control running up to the top resistance line. If you do see it in a downtrend, then it should be paid special attention. This is because it can be seen as a powerful reversal signal.
You see the higher lows there then you see the same level high. So this indicates that as the buyers are gaining more and more control because as the market does sell-off, it sells off less and less. As the triangle pattern matures, a lot of traders are looking for a breakout.
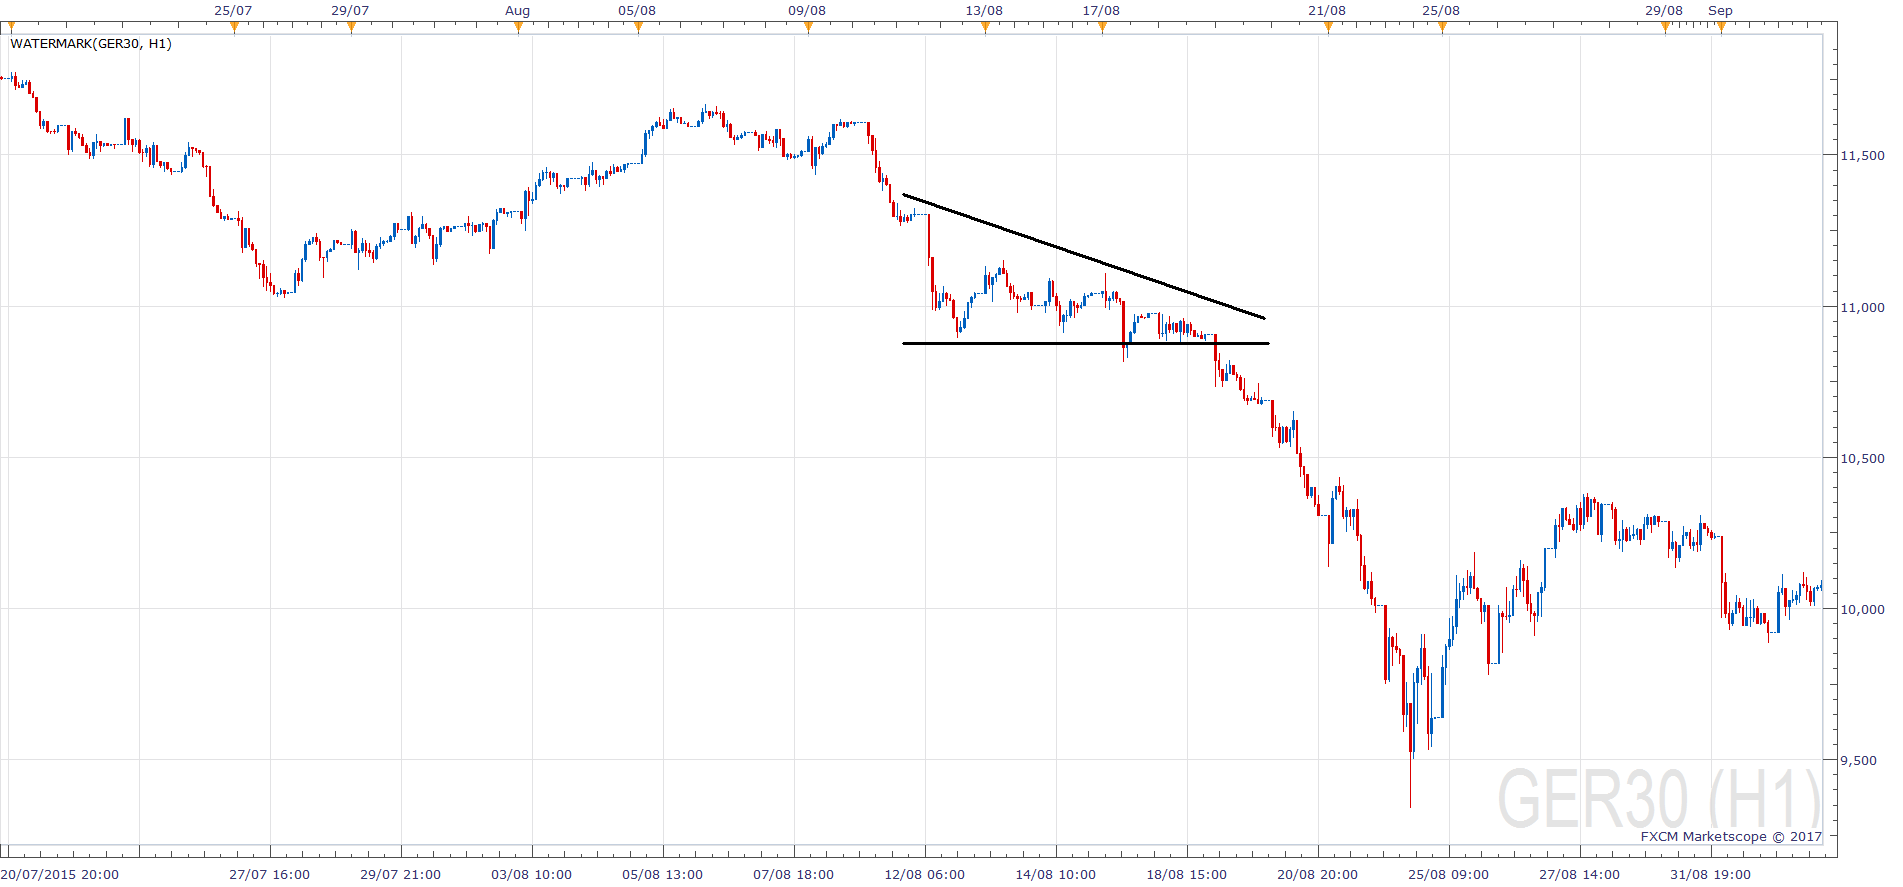
Descending DAX Triangle Pattern
The descending triangle is basically the opposite or the ascending triangle flipped upside down. This pattern forms when lower highs and we make lows at the same level. So it’s horizontal support, but falling resistance. We normally see these patterns in a downtrend and view them as continuation patterns because Bears gain more and more control. If you do see this in the opposite trend, which is the uptrend, you should pay special attention because this is a powerful reversal signal.
Let’s have a look here at what the market is showing from a supply and demand perspective. The chart shows the German DAX. As we make the lower highs, buyers are having less and less control running down into the support line. The sellers are gaining more and more control and therefore a lot of traders will look for the bottom to break for a trading opportunity.
Symmetrical DAX Triangle Pattern
The symmetrical triangle pattern is common. You will see it a lot of times. But you’re going to see this not an uptrend or downtrend, but instead, you will see this in a directionless market. This s because as neither the bulls or the bears or the buyers or the sellers are in control of the market. So this pattern normally has a directionless contracting range so it is unlike the rising or falling wedge. So this triangle is formed when the market makes lower highs and higher lows. It can be a continuation or reversal pattern depending on which way it breaks out of the pattern.
So we can see here the lower highs and then the higher lows forming the pattern. You can see a contraction of the range. When the market does break out, you can see that it does break out pretty forcefully.
So why is that? Well as the pattern matures, the range gets narrower and narrower indicating that neither the buyers nor the sellers have control. But once the pattern does break that’s an indication that one of the sides have taken control.

How to Trade The Triangle Pattern
Ascending Triangle & Descending Triangle Strategy
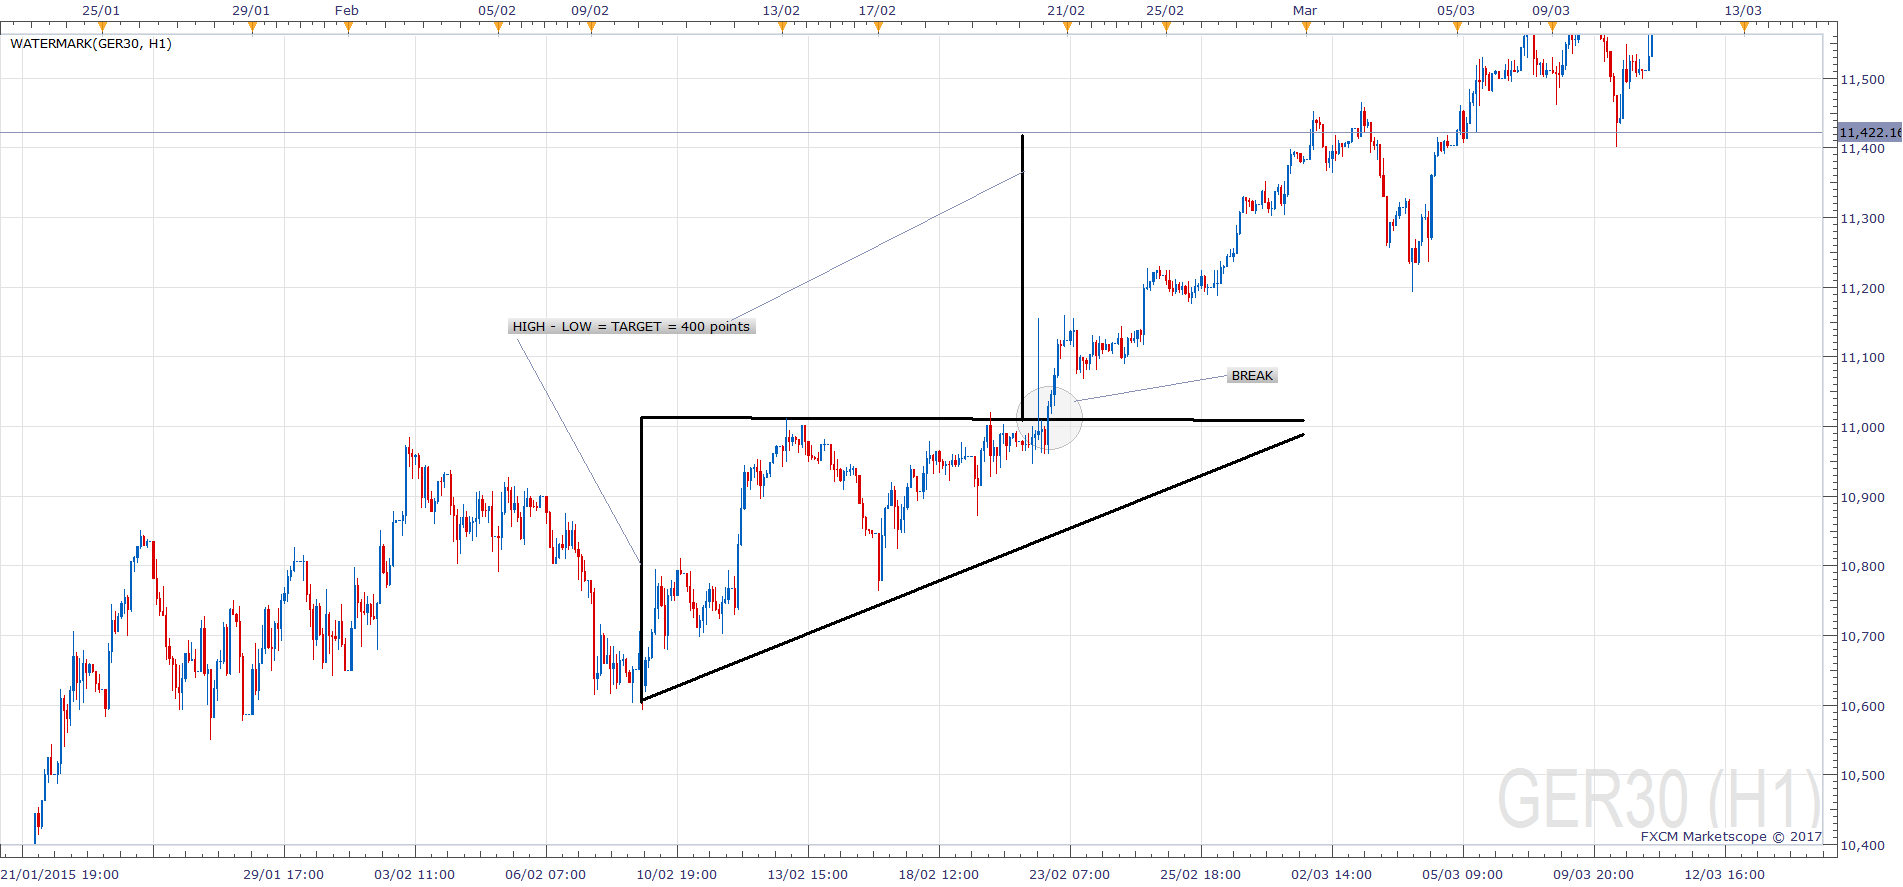
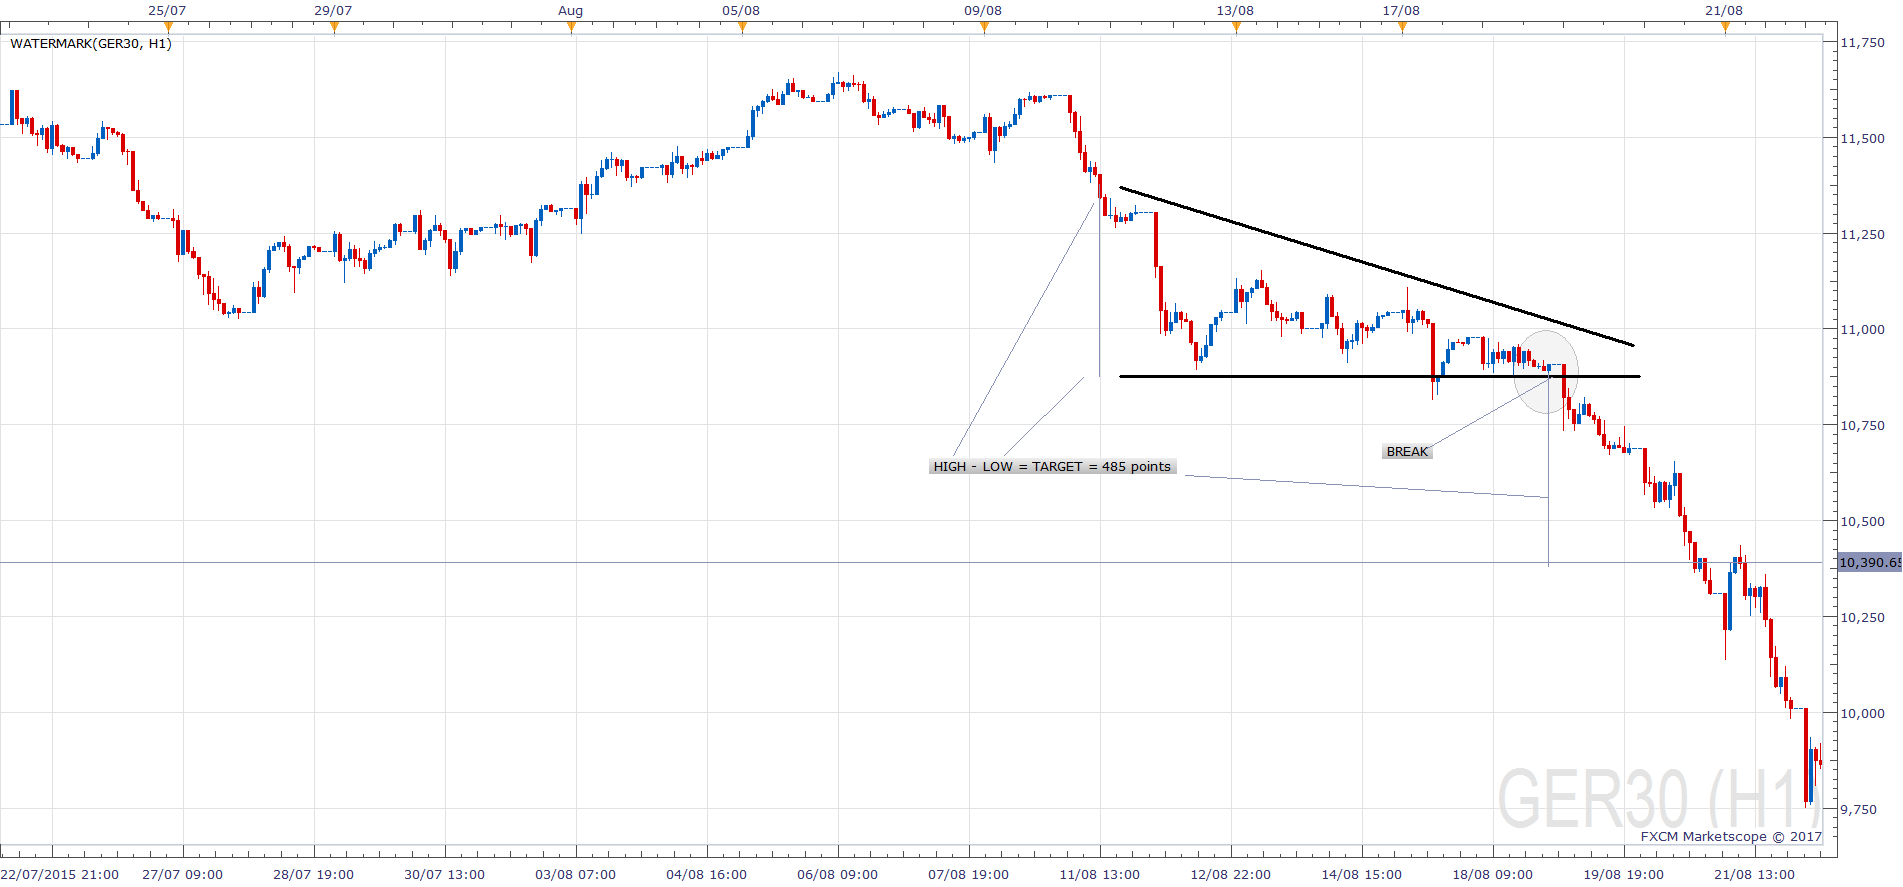
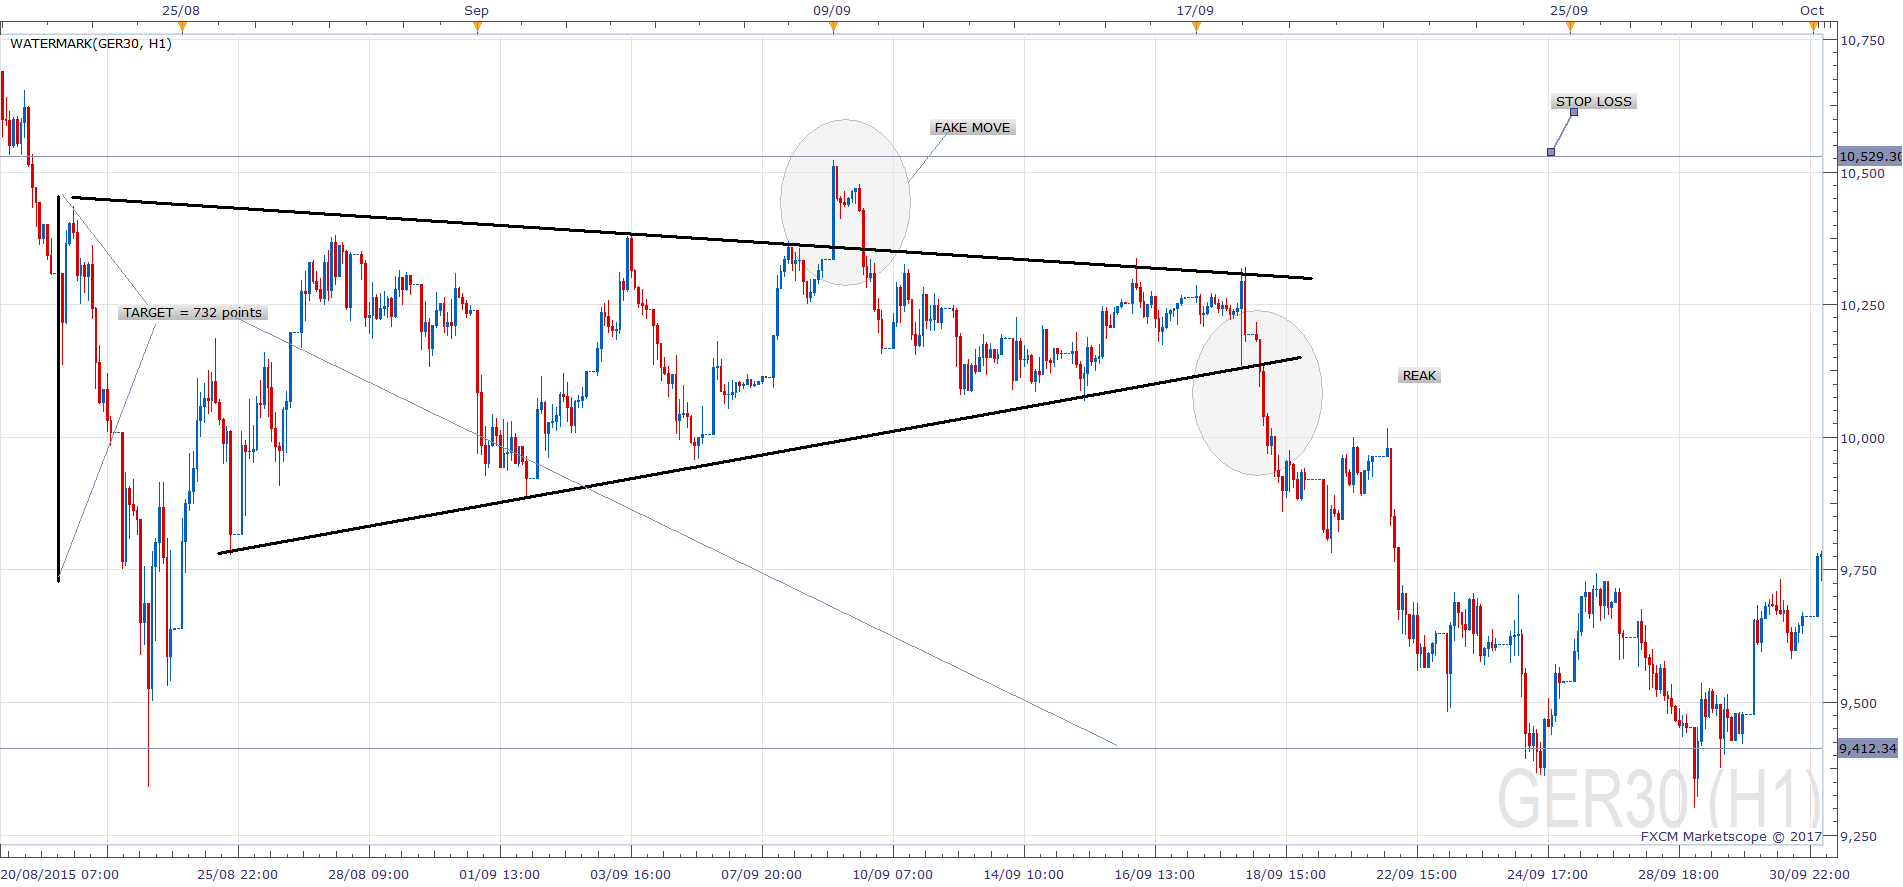
Traders look to trade the break of the upper resistance line (ascending) or the lower support (descending). We derive our target from measuring the distance between the starting high point of the triangle and the low point of the triangle pattern. This difference is then projected from the break point. The stop is in place just below the most recent trough of the ascending pattern, or above the most recent peak of the descending triangle.
For the first example, we’ve got our ascending triangle. We have the break, so we then measure the distance between the high and the low of the pattern (at the start). That is our target for the buy entry. We place our stop just below the most recent trough of the pattern.
For the second example, here’s our descending triangle. You can see there the same one from the last example, we see the break. We work out the distance between the high and the low at the start of the pattern and that’s our target for the trade. We place our stop just above the most recent peak.
The symmetrical triangle strategy
Traders are going to look to trade in the direction of the breakout and it doesn’t matter which side it breaks. This is because the breakout is an indication of the winning side.
So in this example, we have our symmetrical triangle and it has broken to the downside. Traders are going to look to get short. We measure the target in the same way as it is with the other two triangles. We get the high/low distance from the start. That’s our target for the trade and we place the stop just above/below the most recent peak/trough, depending on which way it breaks.
Traders will look at volume as a confirmation tool. This is with all of the triangle patterns. Traders are going to like to see a decrease in volume as the pattern matures and then an increase in volume on the break of the pattern.
Please feel free to find your own examples and post them here.