No matter what time frame you decide to trade the German DAX, it’s important to always have a big-picture overview of what the market is doing. Multi time frame analysis allows you to have this big-picture view. When your technical analysis is lining up on multiple time frames, then the chances of the analysis being correct increase greatly.
Multi time frame analysis | 5-minute chart
Let’s look at a 5-minute chart on the German Dax index. This chart is a popular chart for DAX analysis. Let’s say we’re looking for something very basic, perhaps a trend in the market so we can go with the momentum. It’s clear on this chart that the price is going down. Suppose that we want to enter a trade, just on this chart, to follow the direction of the trend. We would want to sell here and follow the momentum.
Using this chart alone, we have a potential DAX trading signal to sell.
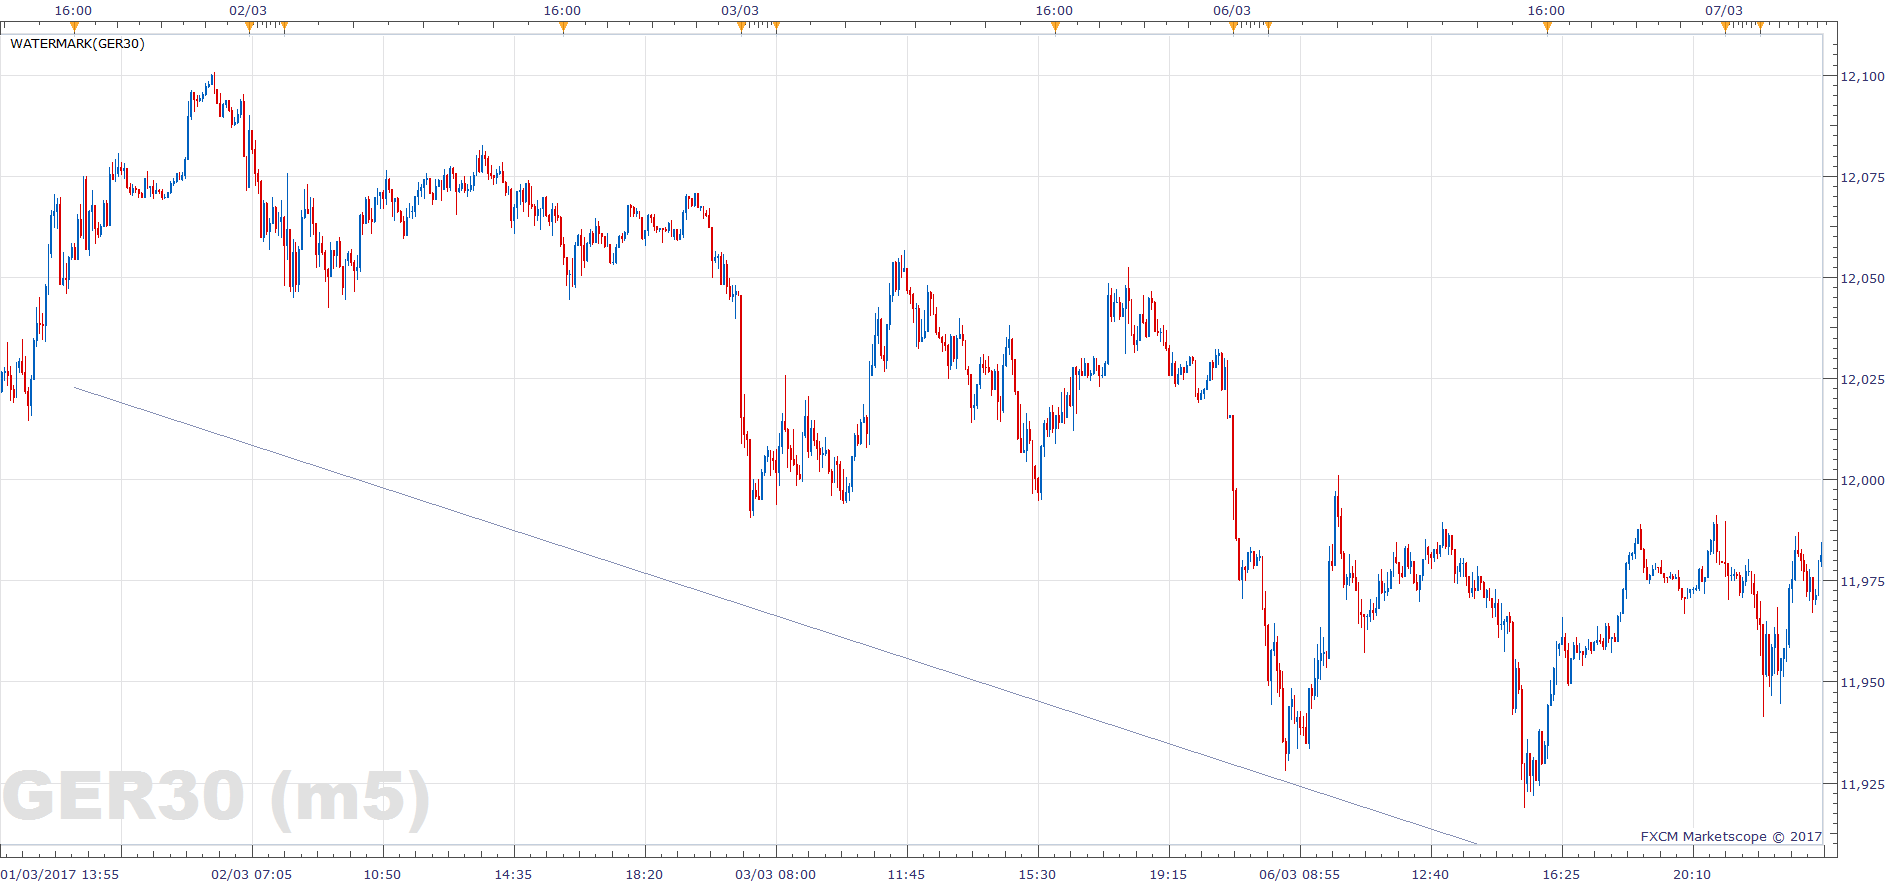
But let’s get a better idea by looking at a longer-term chart, perhaps the hourly chart. We want to find ‘confirmation’ of a similar trend on this time frame. So let’s zoom out, but keep the trend line on the chart for reference.
Multi time frame analysis | Hourly Chart
You can see that on the hourly chart, the trend is going up, not down. It’s a clearly bullish trend on this time frame. So is it still a good idea to sell, like we saw on the previous chart? Let’s go back to our original purpose. We want to open a trade that goes with the momentum. So in this example, no. It’s a bad idea.
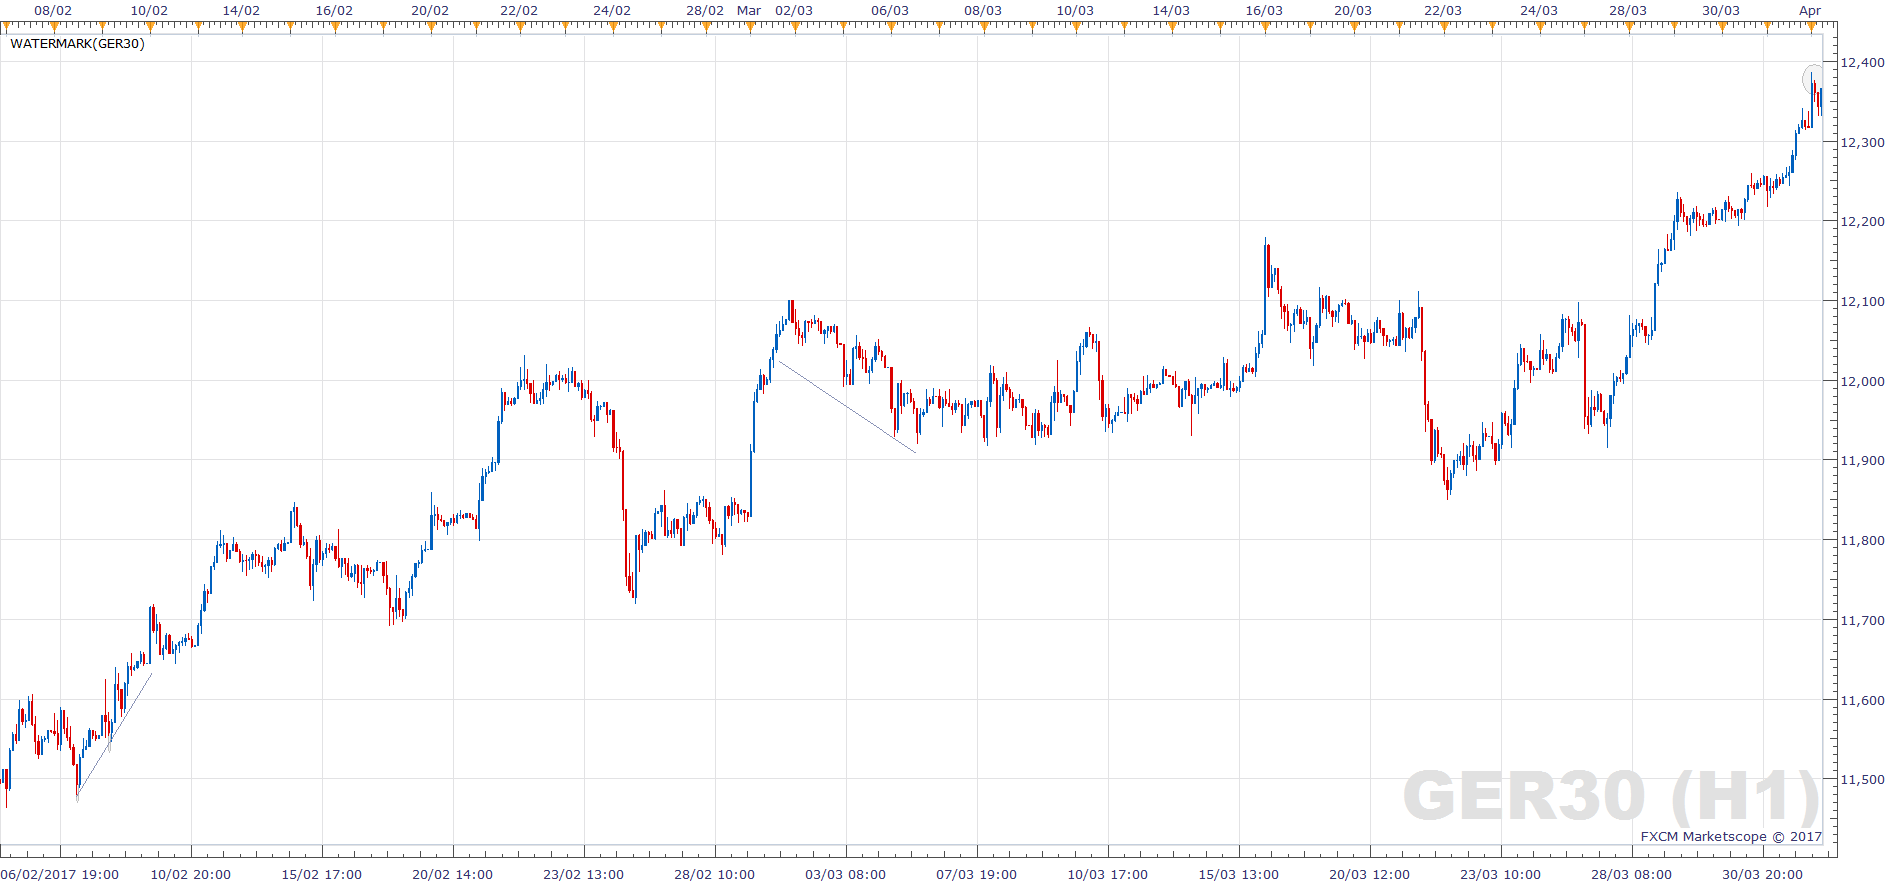
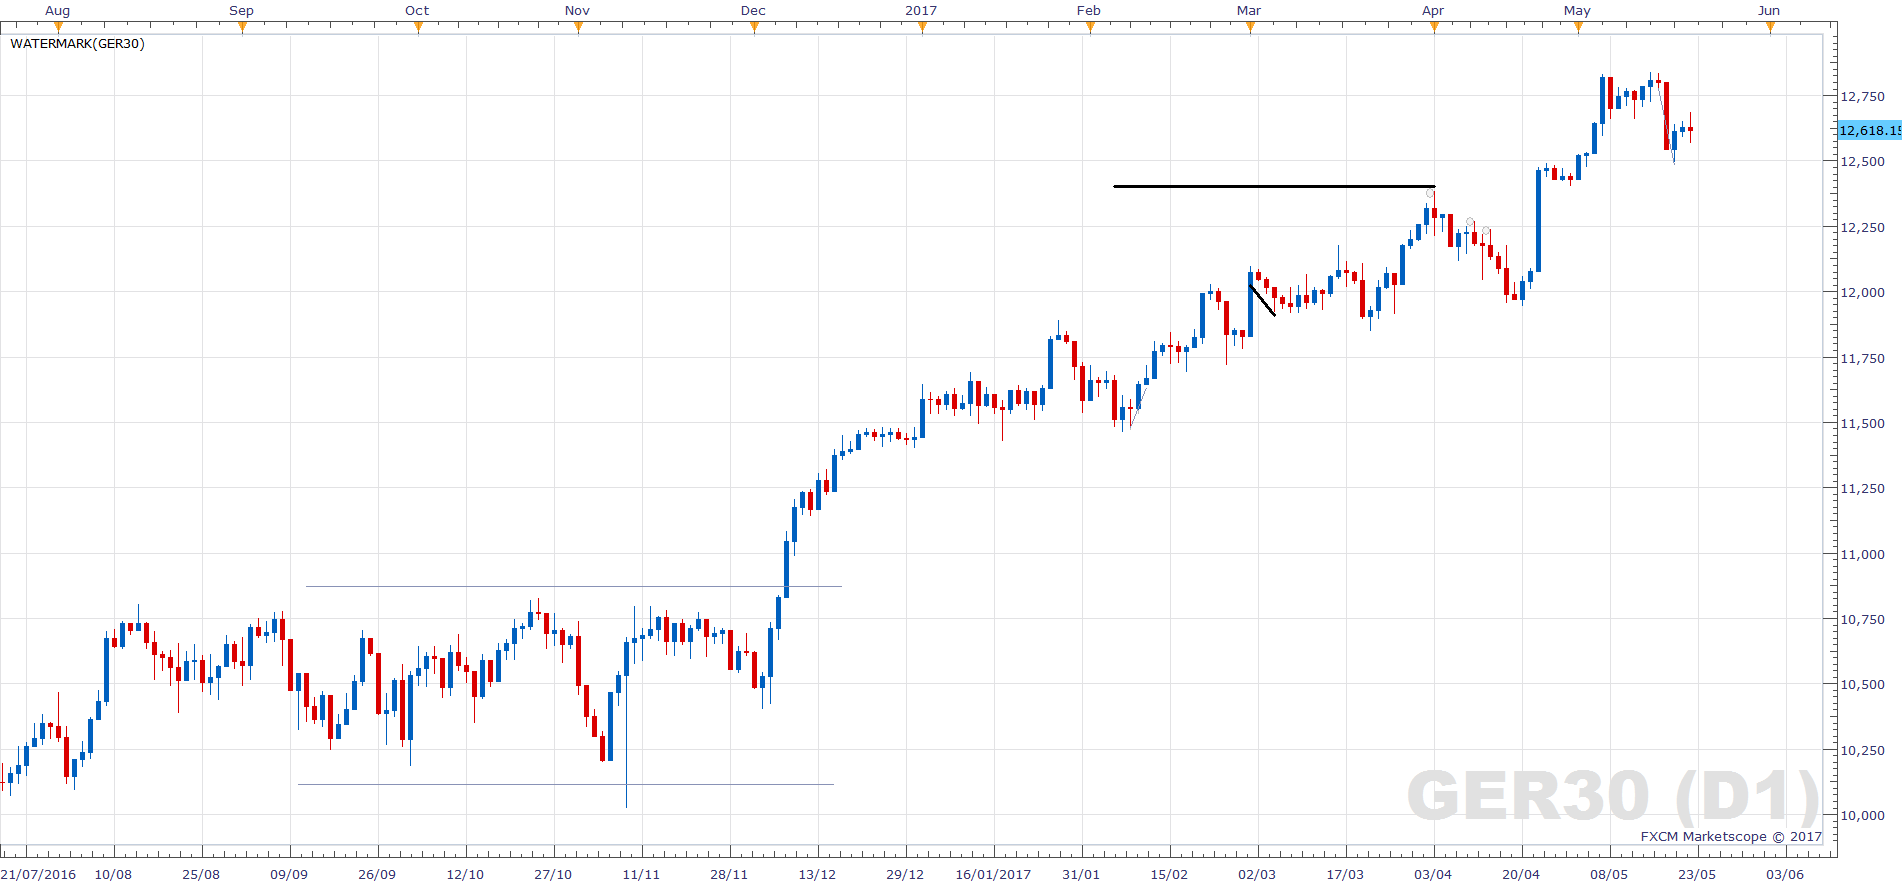
We have one chart saying sell, but a higher time frame saying buy. Let’s look at one more time frame, let’s look at the daily chart. There is no trend line on the hourly chart, so I will mark the area we are looking at. Now we clearly know that the market is going up. The price is actually in a very strong uptrend here, which goes back over six months. So if we want to follow the momentum, a sell is not a good idea.
Multi Time Frame Analysis | Summary
So to summarise, looking back at the 5-minute chart, we were about to place a sell trade because of the downtrend. But now we may want to seriously consider changing our mind as the daily trend is very clearly in the opposite direction. Multiple time frame analysis, in general, means looking at long term charts first. Perhaps even a weekly or monthly chart to get a good feel for the overall trend in the market and then work your way down. You are looking for trading opportunities on the shorter term charts, which go with the longer term charts.
This method of multi time frame analysis is very simple, but it works for nearly all forms of technical analysis. The technical works especially well on the German DAX. For example, support and resistance levels. If a support or resistance level is showing up on multiple time frames then it’s considered much more valid than if it’s just showing up on one. Support and resistance levels on longer-term charts are much more valid than on a shorter term chart.