This unit will look at the moving average technical indicator and we will refer to it as the DAX moving average. There are a few different types of DAX moving average available to use which may be confusing, but this tool can be a great way of ‘smoothing’ out the price action. A good understanding of moving averages will help you understand the German DAX and perhaps get a much better feel for the longer-term trend of the market.
Moving averages have many uses. They can help us understand the short term trend of the DAX or the longer-term trend. They can provide us with DAX support & resistance levels and they can also generate buy and sell signals. But before we get to that, let’s first have a look at the two main types of moving averages; simple and exponential moving average.
Simple DAX Moving Average
The simple DAX moving average is the most basic type of moving average. First of all, you choose a period, let’s say 20. The moving average will take the past 20 data points and display the average of that data. Then for every new candle, it will remove the oldest piece of data and replace it with the new one. It then updates the average. This means every time a new candle is drawn, an updated average is drawn too. So the average moves, because it is a moving average.
It is often called an MVA or an SMA. You find it on MetaTrader under the ‘Trend’ indicators.
We don’t need to go to heavily into the mathematics of the moving average calculation because most charting packages do it for you. But if you do want to understand it better, then Investopedia has it covered here:
http://www.investopedia.com/university/movingaverage/movingaverages1.asp
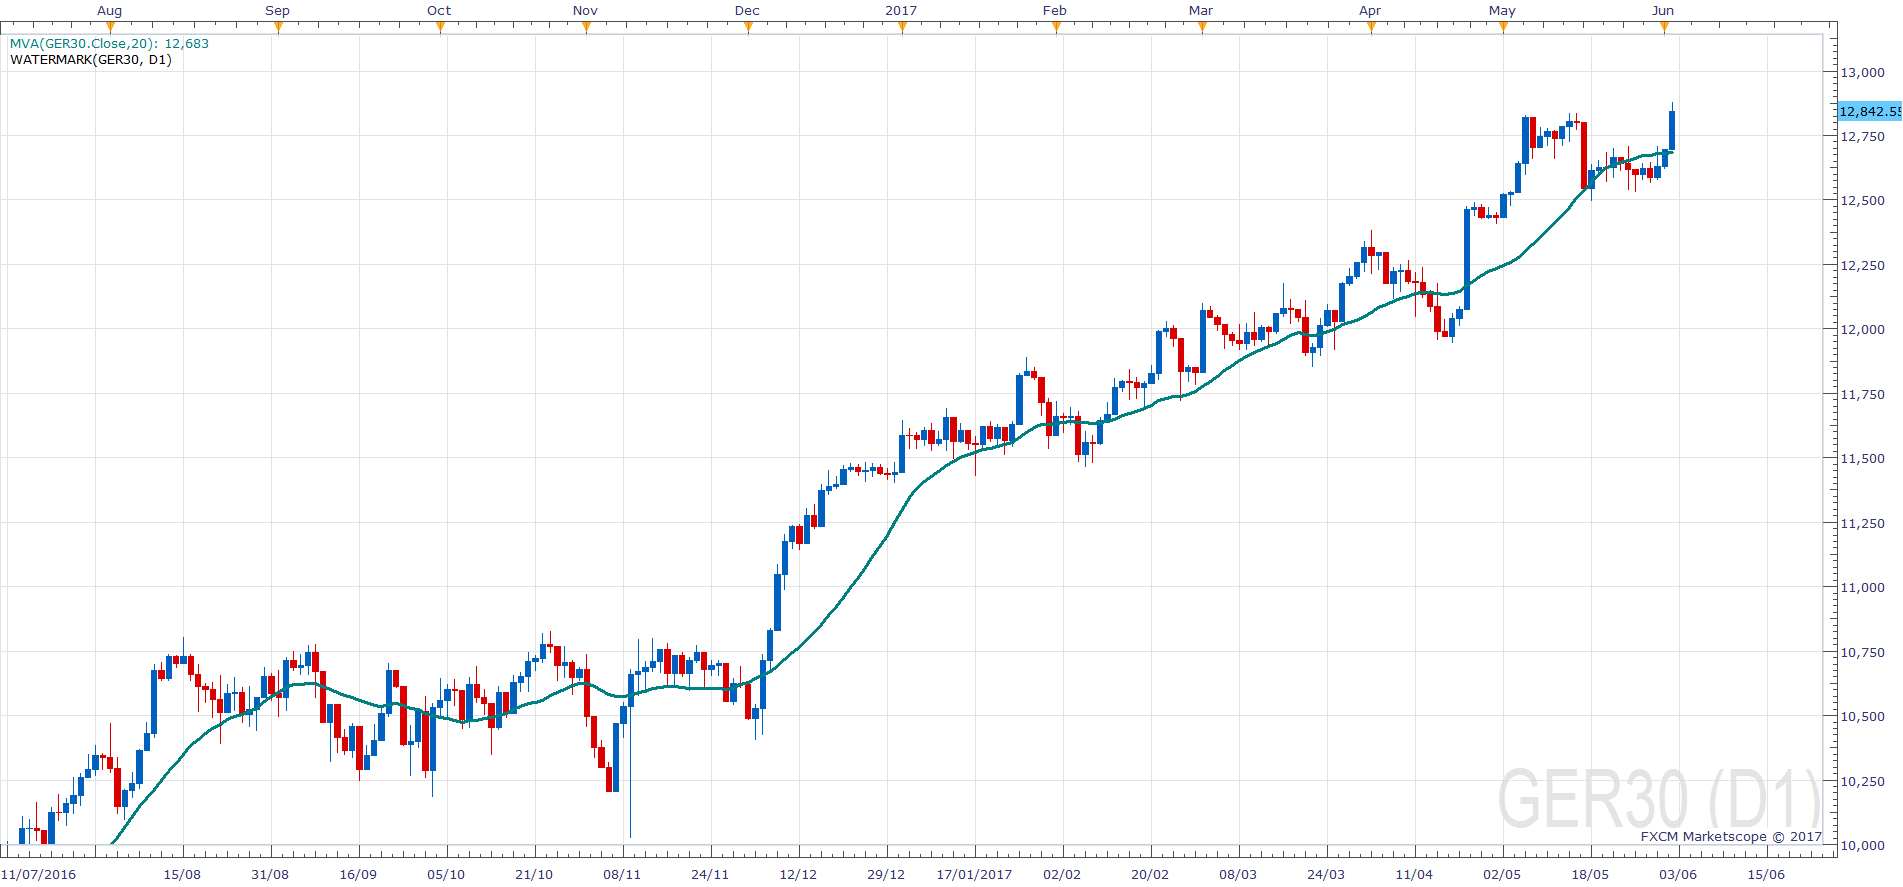
This chart shows the German DAX with a 20 period simple moving average on the daily chart. Otherwise known as a 20-day SMA. Each data point that makes the line you see, is an average of the previous 20 days. It smoothes out price action and shows that price action has been moving up.
Exponential DAX Moving Average
Using the example above, some traders and researchers dislike the simple moving average. They believe that it has a flaw because it gives the same importance to all data from each of the previous 20 days. For example, they believe that data from yesterday and the day before is more relevant than data from 19 or 20 days ago. So the critics say there that the more recent data point should be given more importance when predicting future price action. Therefore the exponential DAX moving average gives more weight to the more recent data points. It remains a moving average, the same as the simple moving average, but it will provide different results. Typically it reacts faster to price movement.
I will not go into the formula in this unit because it’s much more complicated. So just understand that the simple moving average is going to react slower than the exponential moving average.
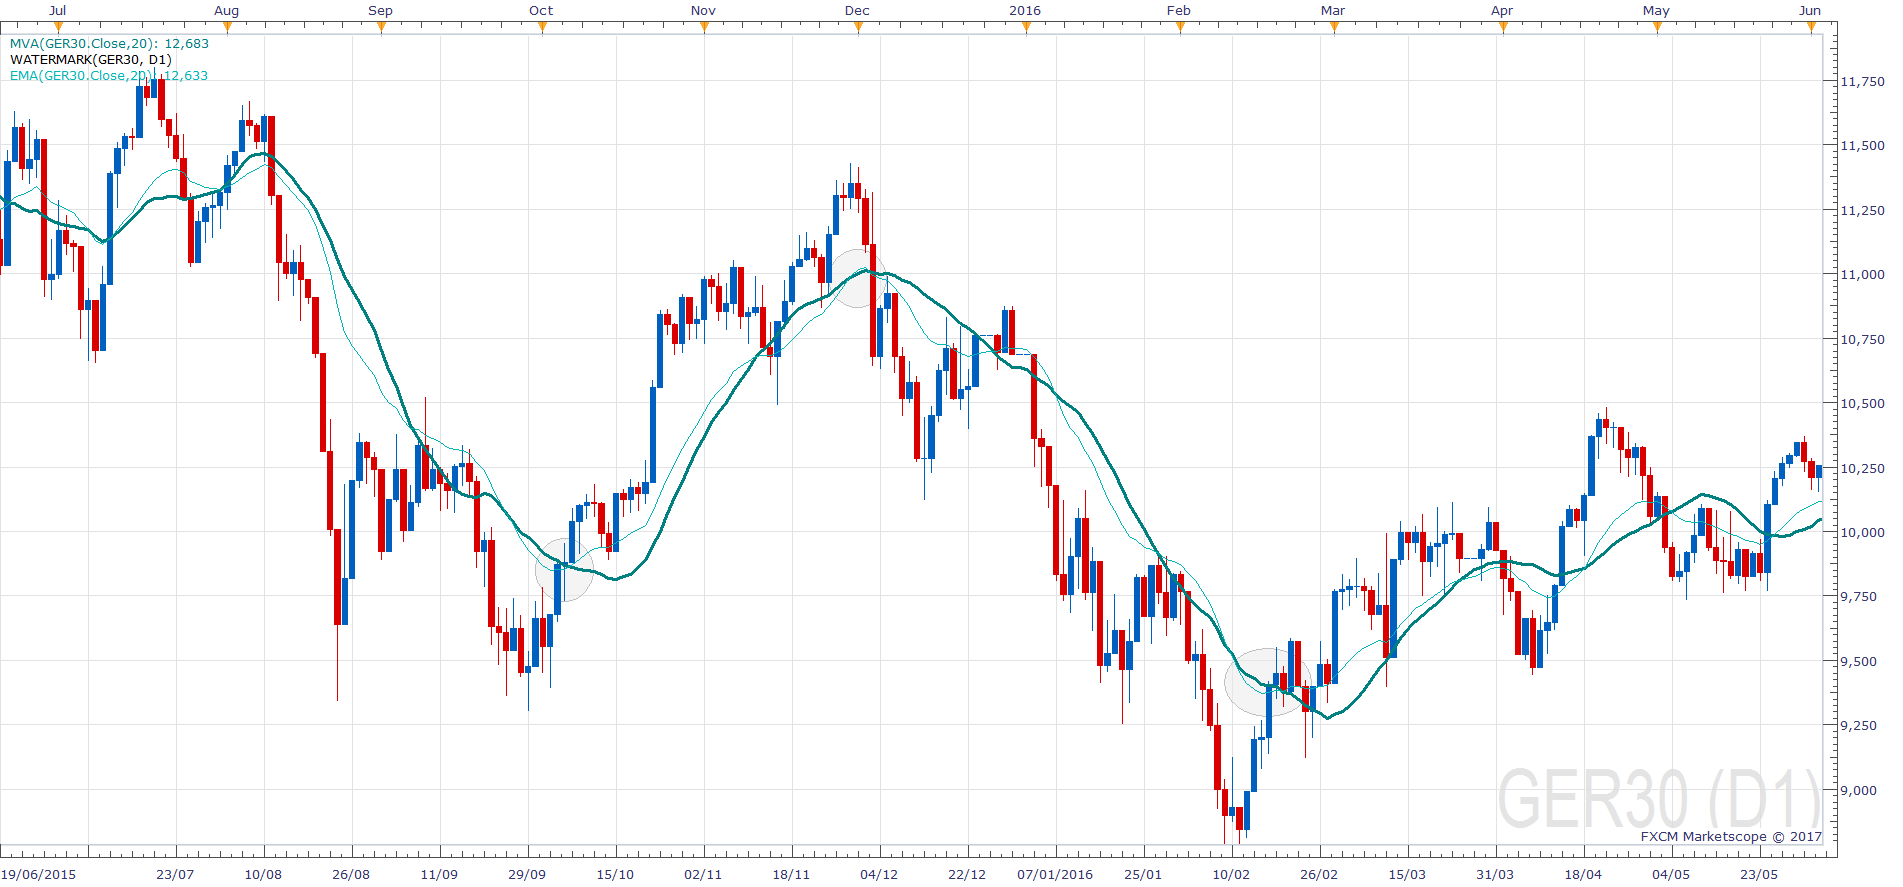
This chart now shows both the 20-day SMA and the 20-day exponential moving average (EMA). In this case the exponential moving average the blue line is the simple moving average is the red line. The EMA is quicker at adjusting to the moves. There are a number of peaks and troughs here, and the blue line is normally ahead of the red one.
Which DAX Moving Average is the best?
Regarding preference, each trader may choose a different moving average type with different periods on different timeframes. I personally use a Simple DAX Moving Average because I build algorithms. I understand that the EMA is a little faster to predict moves, but it’s much more difficult to use in an automated program. SMAs require fewer calculations and are easier to backtest, so I recommend those for anyone looking at automation.
Chart timeframe is also important. If we are looking to scalp the DAX, we’d probably use an EMA because it reacts faster. If we are using the higher timeframes for swing trading, we’d probably use an SMA because it produces fewer false signals.
You should probably understand which method fits best with your trading strategy in your trading plan. There are literally hundreds of different ways that traders can use moving averages on the DAX. We will often use them to trade with a trend as well as to identify potential areas of support or resistance. This may result in a continuation or reversal of a trend. So let’s look at three popular (simple) examples of using moving averages on their own.
- Buy above and sell below
- Moving Average as Support & Resistance
- Moving Average Crossover
Buy above the DAX Moving Average and sell below
This is the most basic way you can use a moving average to trade. The idea is very basic. When price crosses the moving average, you trade in that direction. If you started below the moving average and then price crosses above, you buy. If you started above the moving average and then price crosses below, you sell. You exit the trade when you receive the reverse signal. This strategy only works if the market is trending. Let me show you.
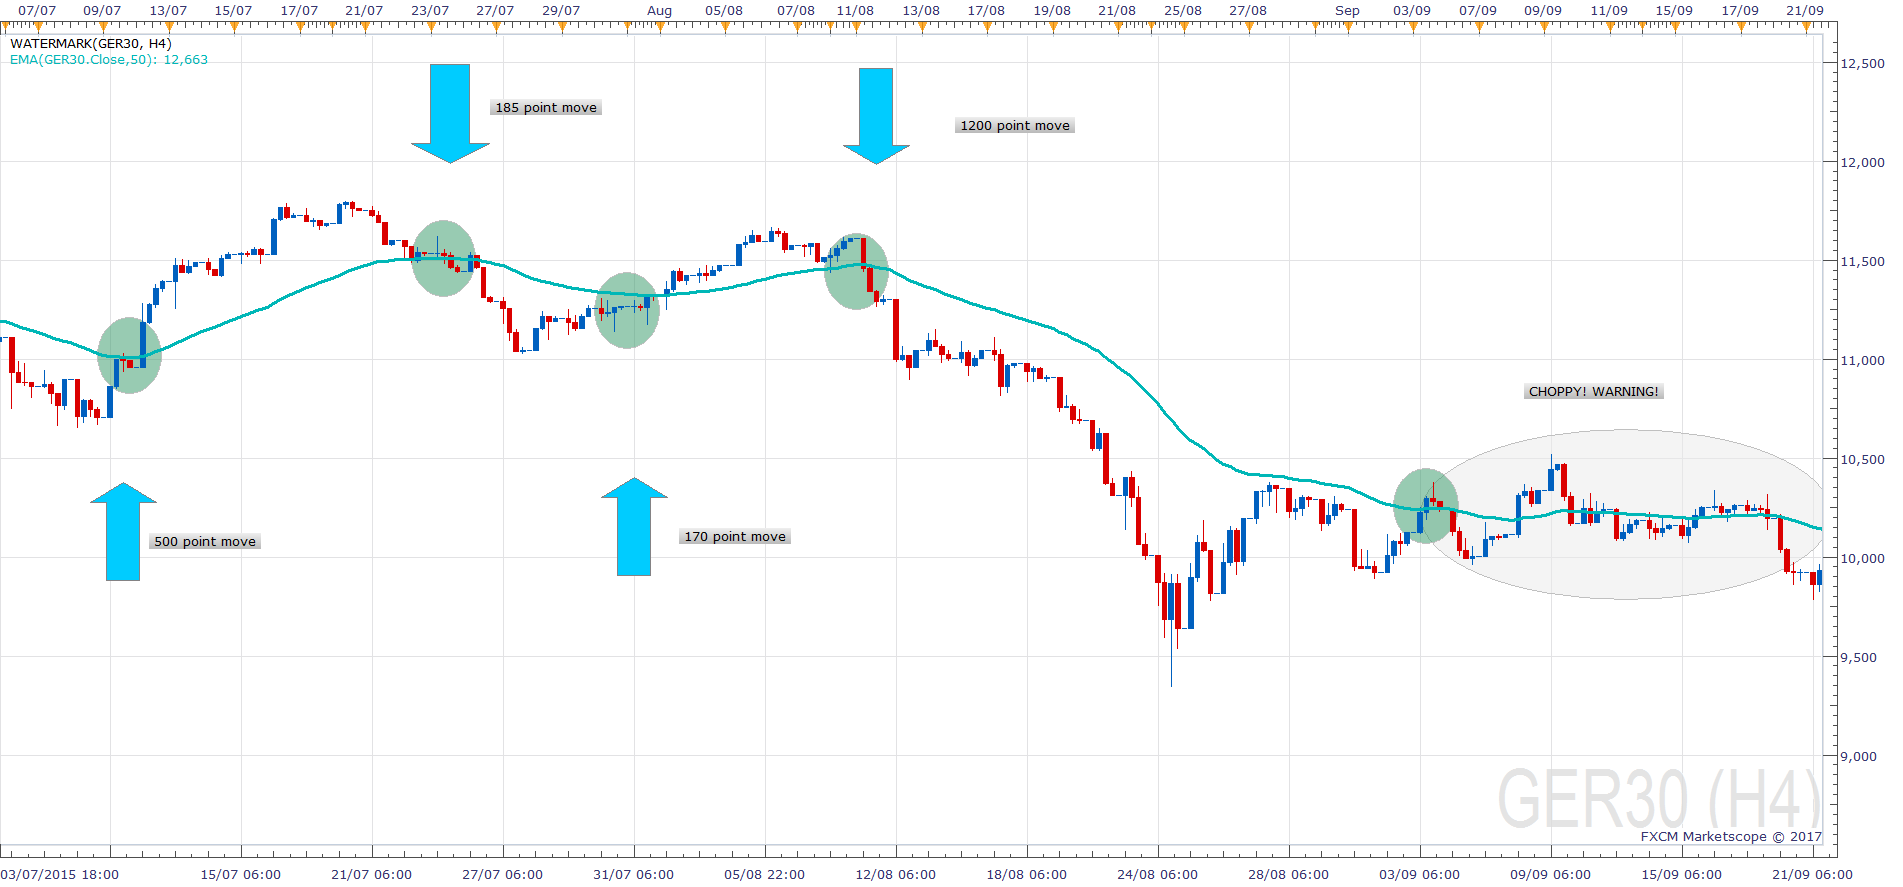
I have an H4 chart, from around July/August 2015 on the DAX. I have placed a 50 period EMA on the chart. There are four decent trades there when price crosses the EMA. The moves would have earned around 2200 points (approximately) in two months. If we trade a standard contract at €25 a point, that’s a lot of money. But even if we trade mini futures or spread-bet at €1 per point, that’s still a good result. However, as soon as it gets choppy, you will be buying and selling and buying and selling and making loss after loss after loss. So that’s probably not going to be a strategy that you’re going to want to use by itself.
DAX Moving Average as Support & Resistance
You will hear a lot of traders, including myself, refer to the 200-day EMA as an important level. It represents 40 weeks of working days, similar to the educational year. It’s considered a standard technical level to watch. It’s almost like a self-fulfilling prophecy because all traders are taught to respect it, so they do. As a result, the price action tends to respect it as well and the cycle continues.
Price will come down and ‘test’ this important level before continuing higher. Or it may already be below the 200-day EMA and it will climb to reach it, touch it temporarily and then continue to fall lower. Traders can use this information to their advantage and trade with it. When the price comes close to the 200-day EMA, they will speculate a bounce and trade in the opposite direction. Therefore traders are using the EMA as a level of support and resistance. Other popular numbers used include the 50 and 100 EMA.
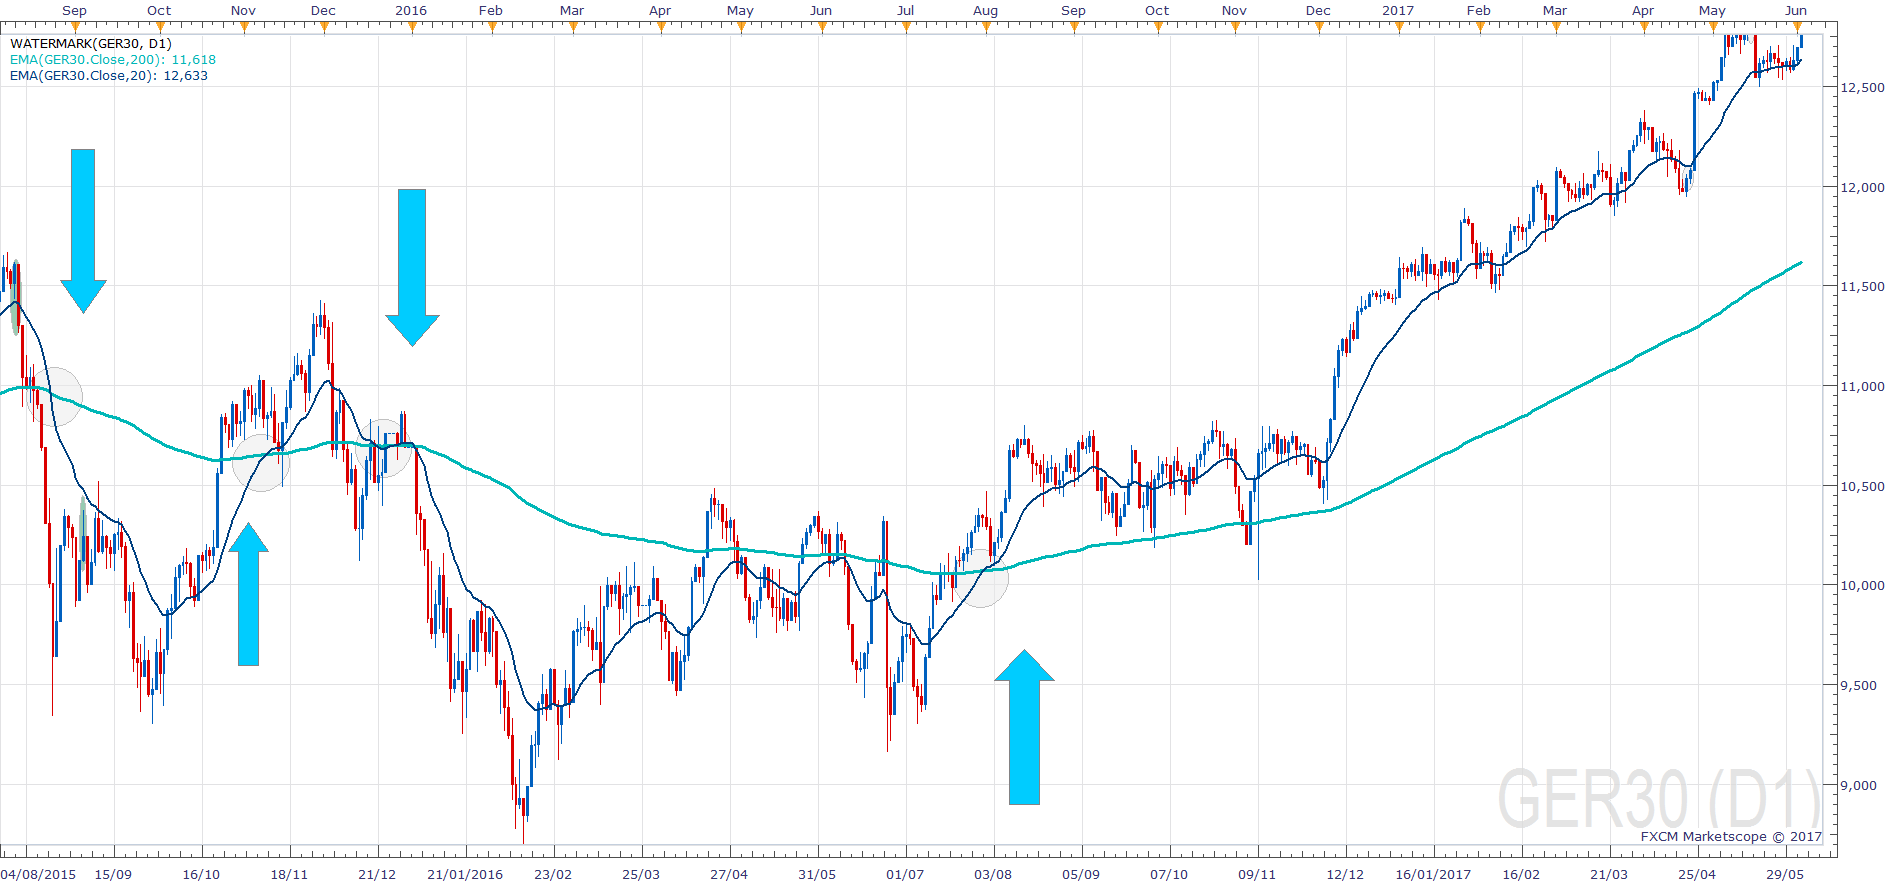
In this example, I am using a daily German DAX index chart from Aug 2012 to Nov 2014 and I have used a 200 period EMA. The price action did respect the 200 EMA as a number of times, allowing a trader to buy during that time. Once price did cross below, it would signal a reversal or a period of sideways price action.

DAX Moving Average Crossover
This involves plotting a longer-term moving average on a chart with a shorter-term moving average. One of the most popular combinations here is to use the 20-day EMA and the 200-day EMA. The advantage is that it allows an additional level of ‘confirmation’ before you get into a trade, this can increase the chance of success. Go and plot them on a chart and have a look to see if it can make money.
Moving Average Roundup
So now you understand these strategies, you can hopefully see lots of opportunities when you can make money. But obviously, you know this was done in hindsight. And hindsight is 20/20. These indicators are lagging indicators and are very difficult to predict accurately, so please remember that trading financial markets is risky and involves the risk of losing your invested money. Please also be aware that the calculation of a moving average has many variable parameters, meaning that you can choose different options within a moving average on the chart. Each option may produce a different result. There are also more than just twp types of moving average, so do your homework if you want to understand them all.