This DAX support and resistance article is one which I encourage you to return and read multiple times because it’s a common technique in trading and will help your understanding of the German DAX’s price movements at particular levels and zones. Don’t be fooled into thinking that you know it already as technical analysis should always be practised.
As you may already know, the price of a financial instrument like the German DAX is ultimately determined by supply and demand. Put simply, if the demand for a financial instrument is increasing in relation to supply then the price will rise. Whereas if the demand for a particular instrument is decreasing in relation to supply, the price will fall.
So when we see an uptrend on a chart, we are seeing a period of time where demand has continuously increased in relation to supply. On the other hand, when you look at a downtrend, we are seeing a period of time where demand has continuously decreased in relation to supply. what we’re going to look at today is price levels where the
In this article, I want to look at price levels where the supply-demand equation reverses and price is expected to stop moving in the direction it was moving. So let’s look at the definition of DAX support and resistance and see a couple of examples on some charts.
DAX Support
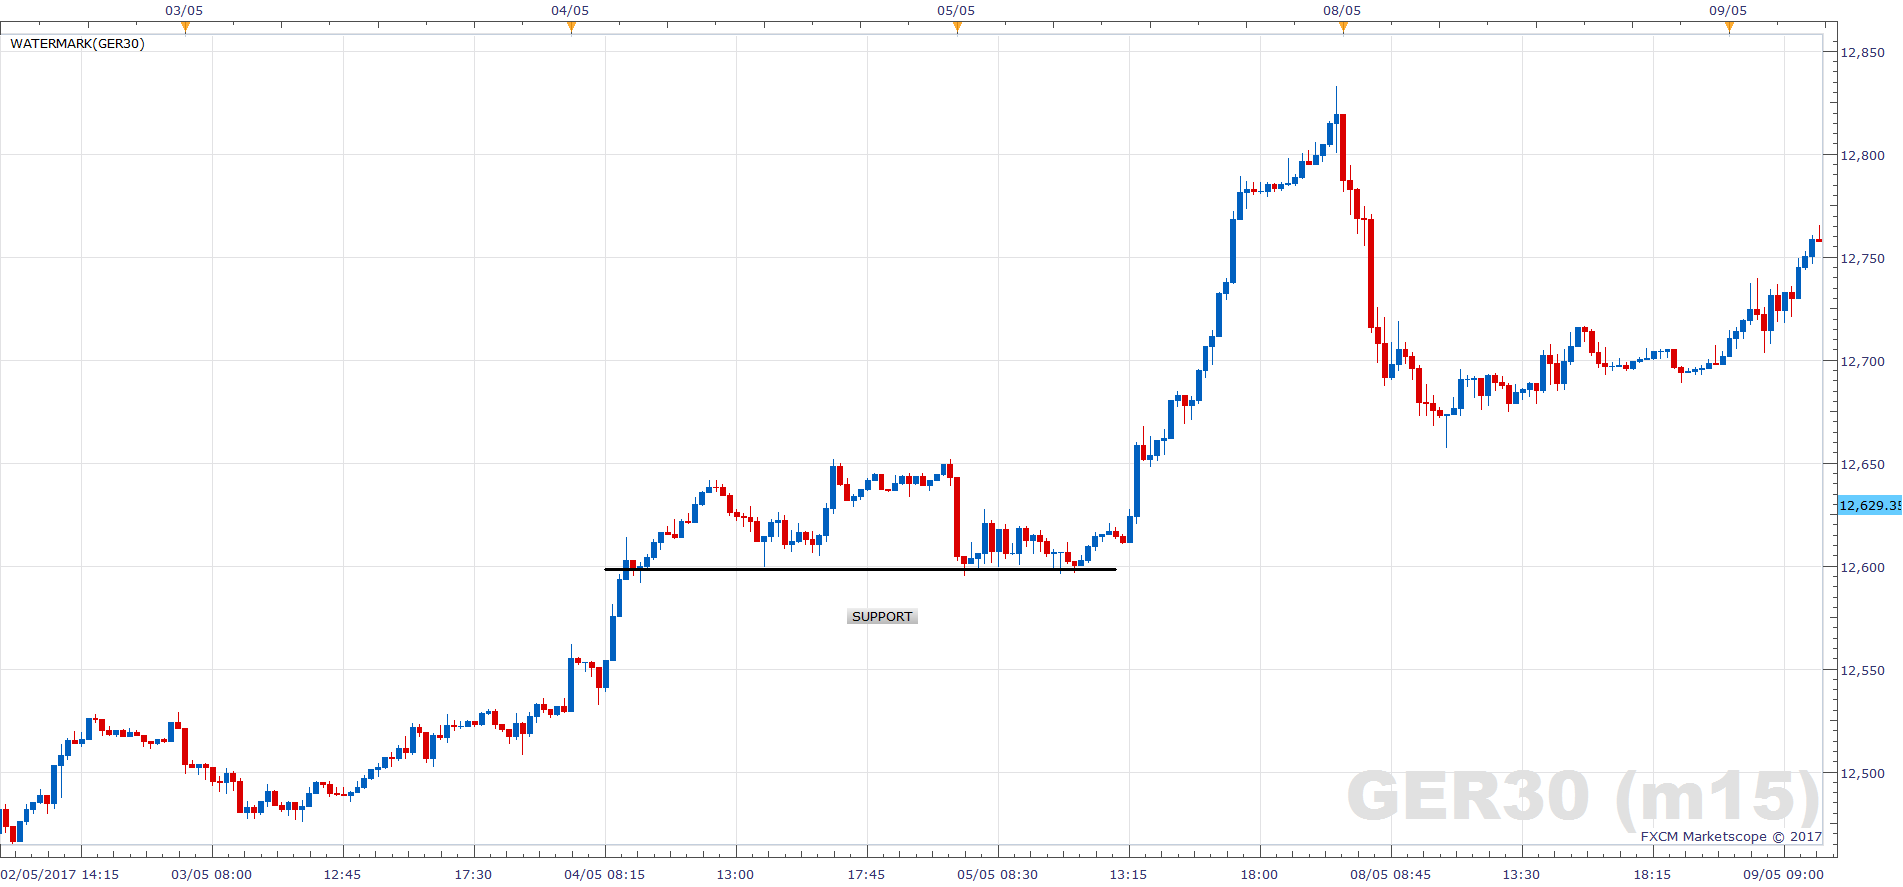
Support is the price level of a particular instrument where there is enough demand should price reach that level to keep prices from falling further.
So in this example, you should be able to see a pretty good example of support. You can see that price has touched that level multiple times and then actually bounced off of that. Once it bounced, it never returned to touch it. So in summary, that support level is held.
DAX Resistance
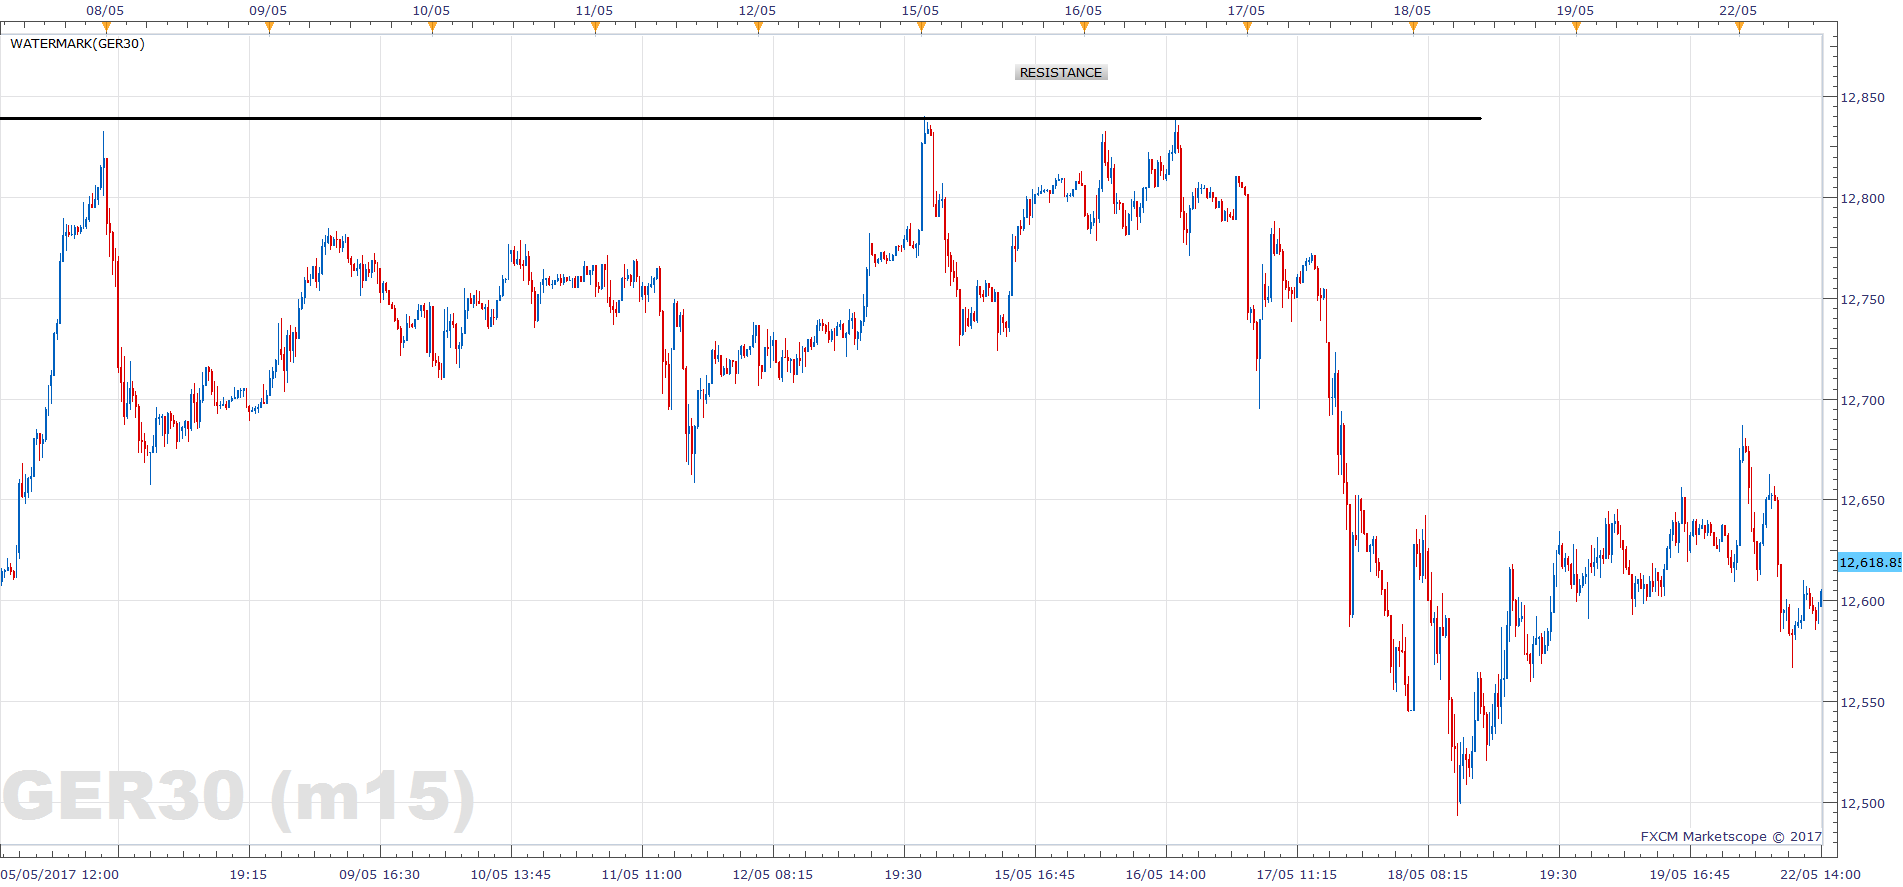
Resistance is the price level of the German DAX where there is not enough demand, should the market reach that level, to keep prices rising further. It hits a wall and struggles to make any further progress.
Here, you can see here that price touches this resistance line multiple times. These first two tests are enough to establish a resistance line. However, the third time is a pretty good confirmation of that. So I hope you can see there the difference between DAX support and resistance. In this example, you can also see that the price did not break through that level.
DAX Support and Resistance (Trend)
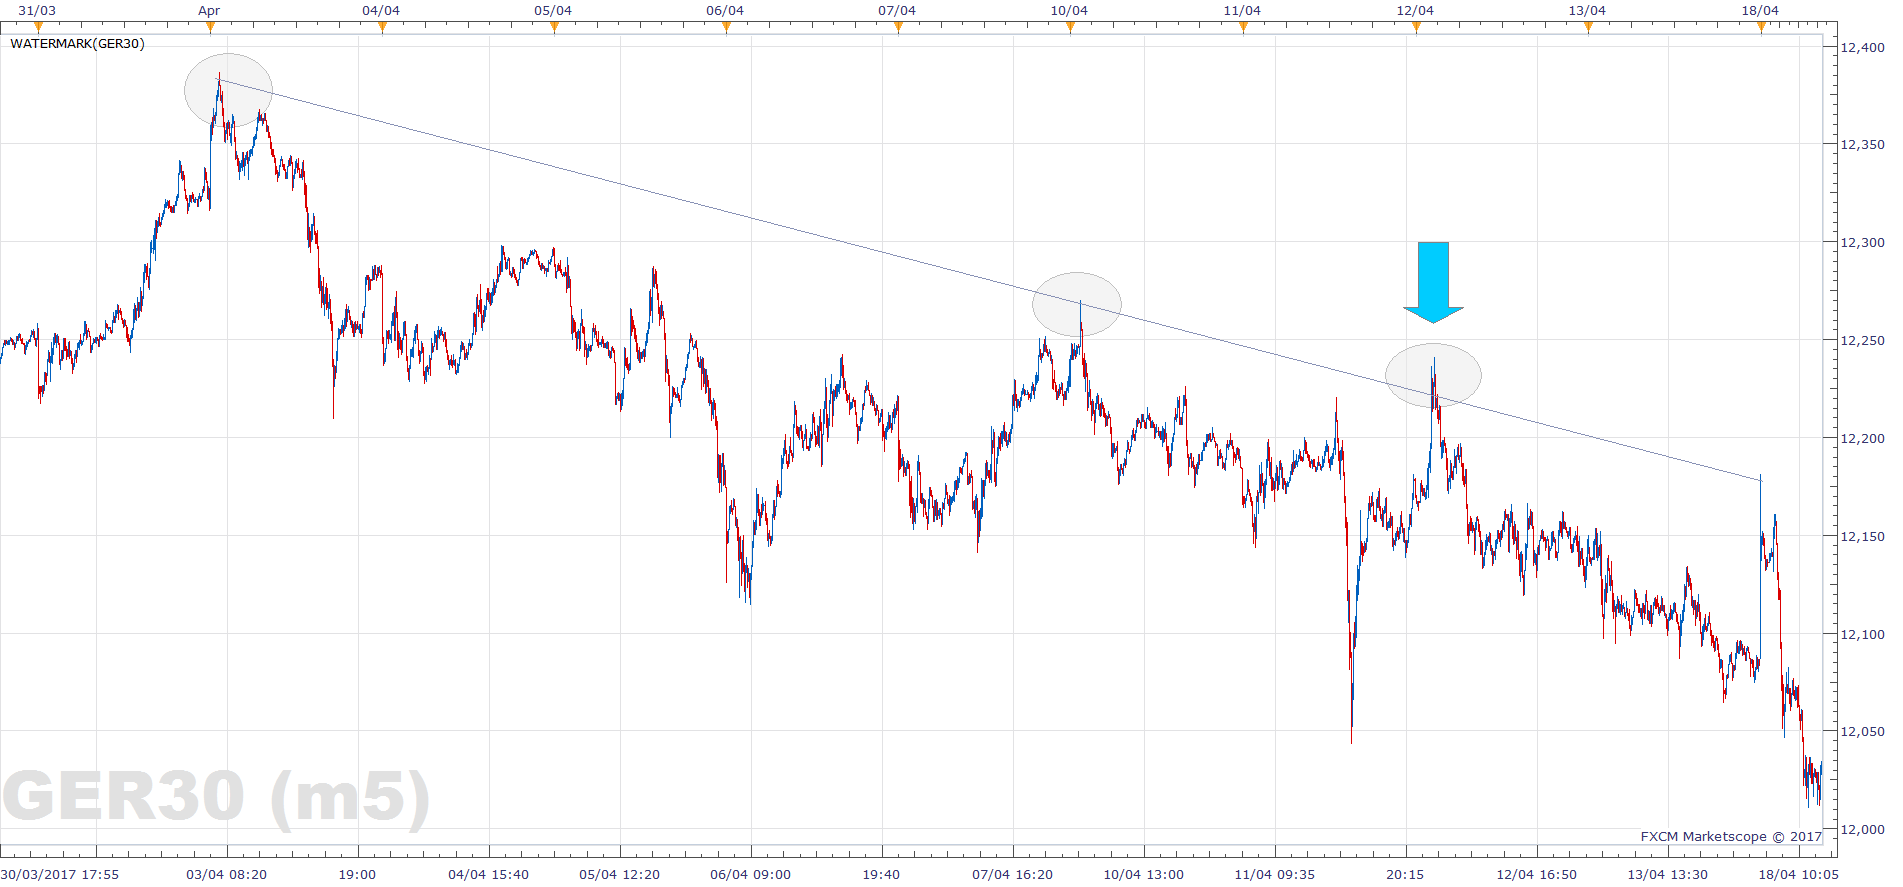
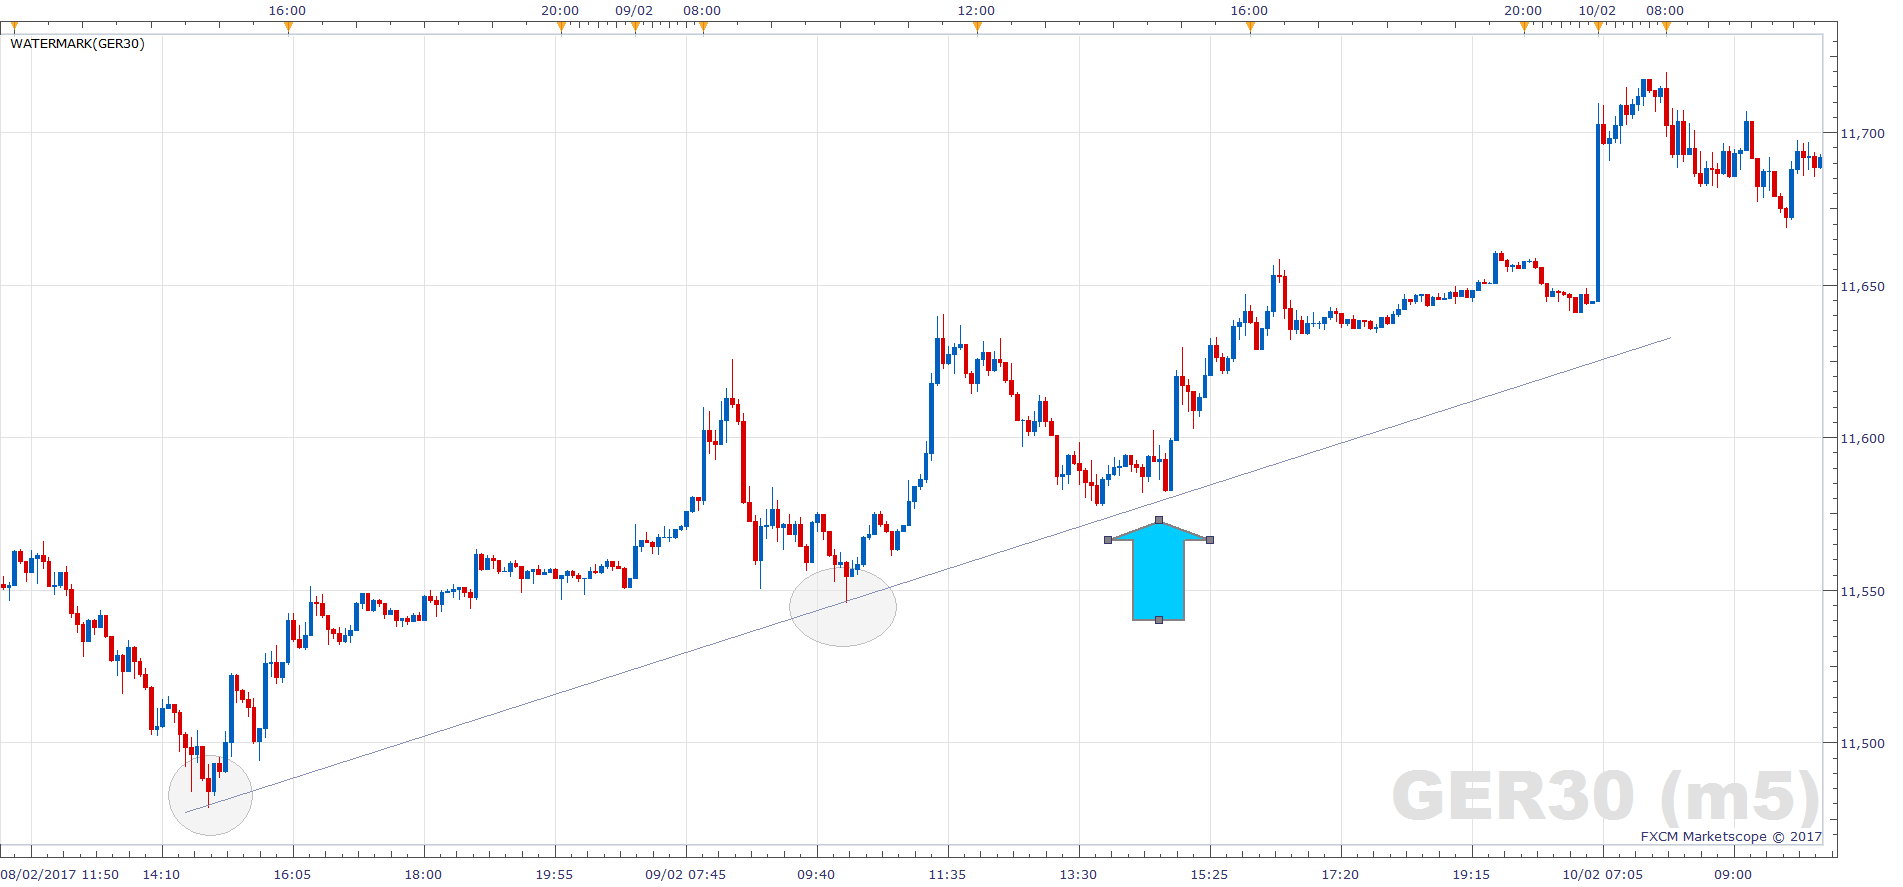
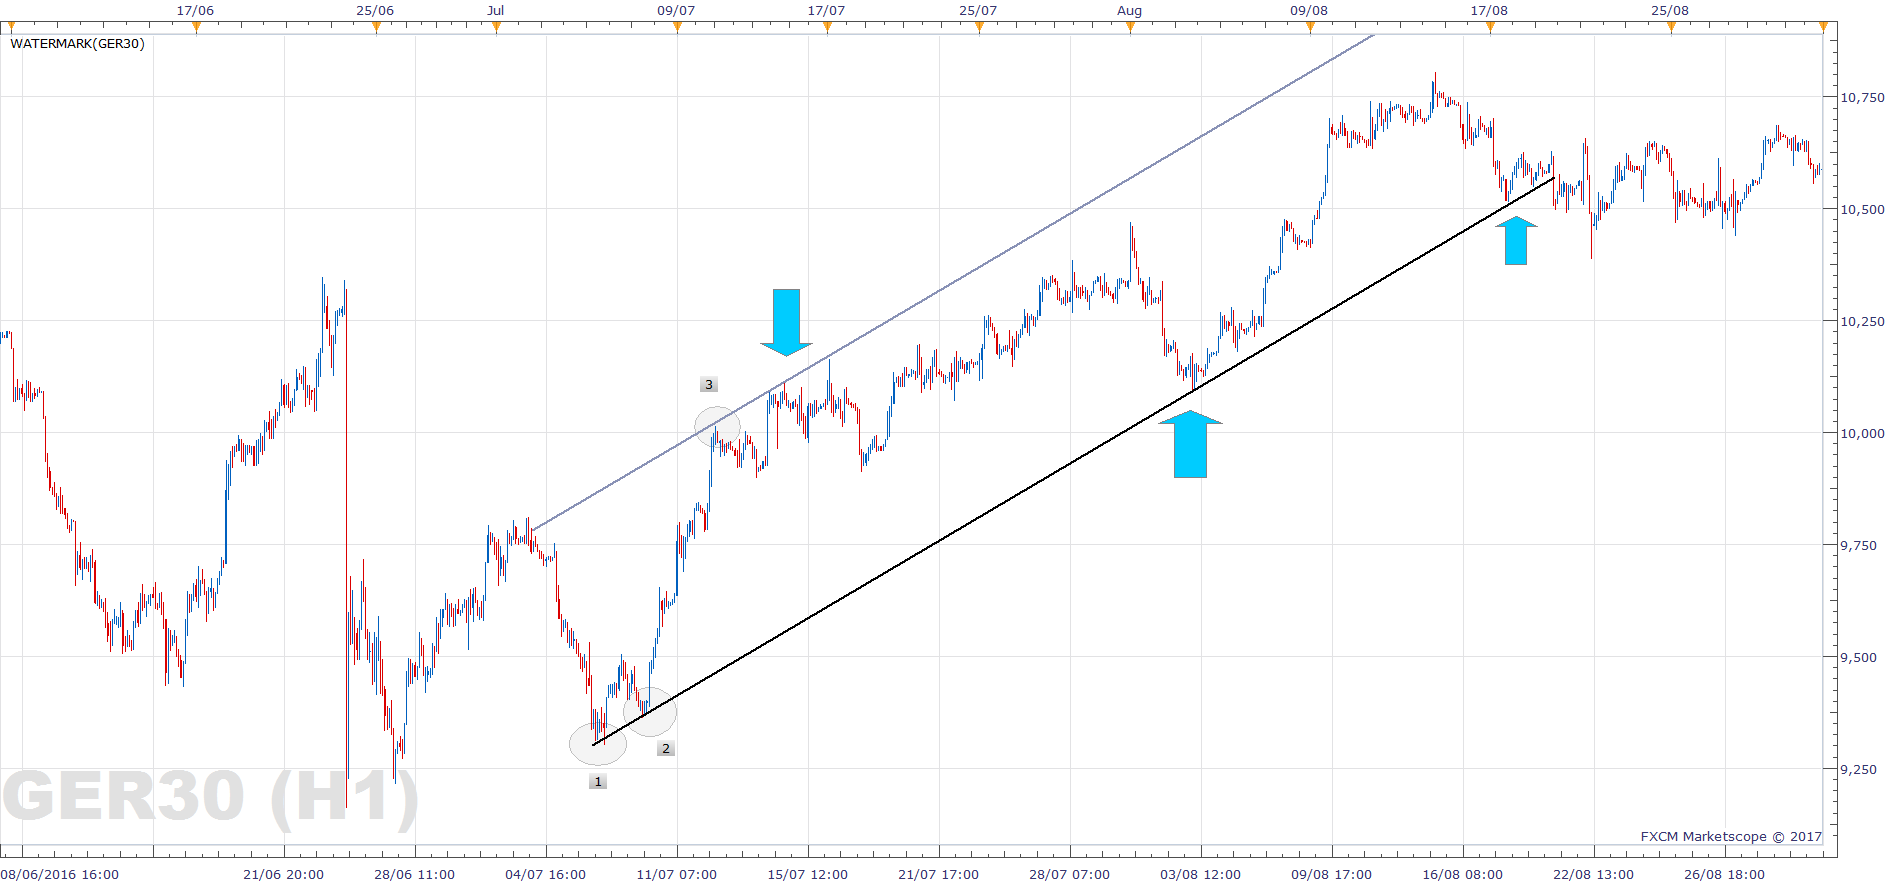
These examples were for prices in a ranging market, one without a clear trend. However, DAX support and resistance levels do occur in trending markets too. So the easiest way to plot them is to use trend lines. Here are a couple of examples on the German Dax. In the uptrend here you can see the price coming down, touching that uptrend line multiple times. On the other hand, the downtrend is the reverse.
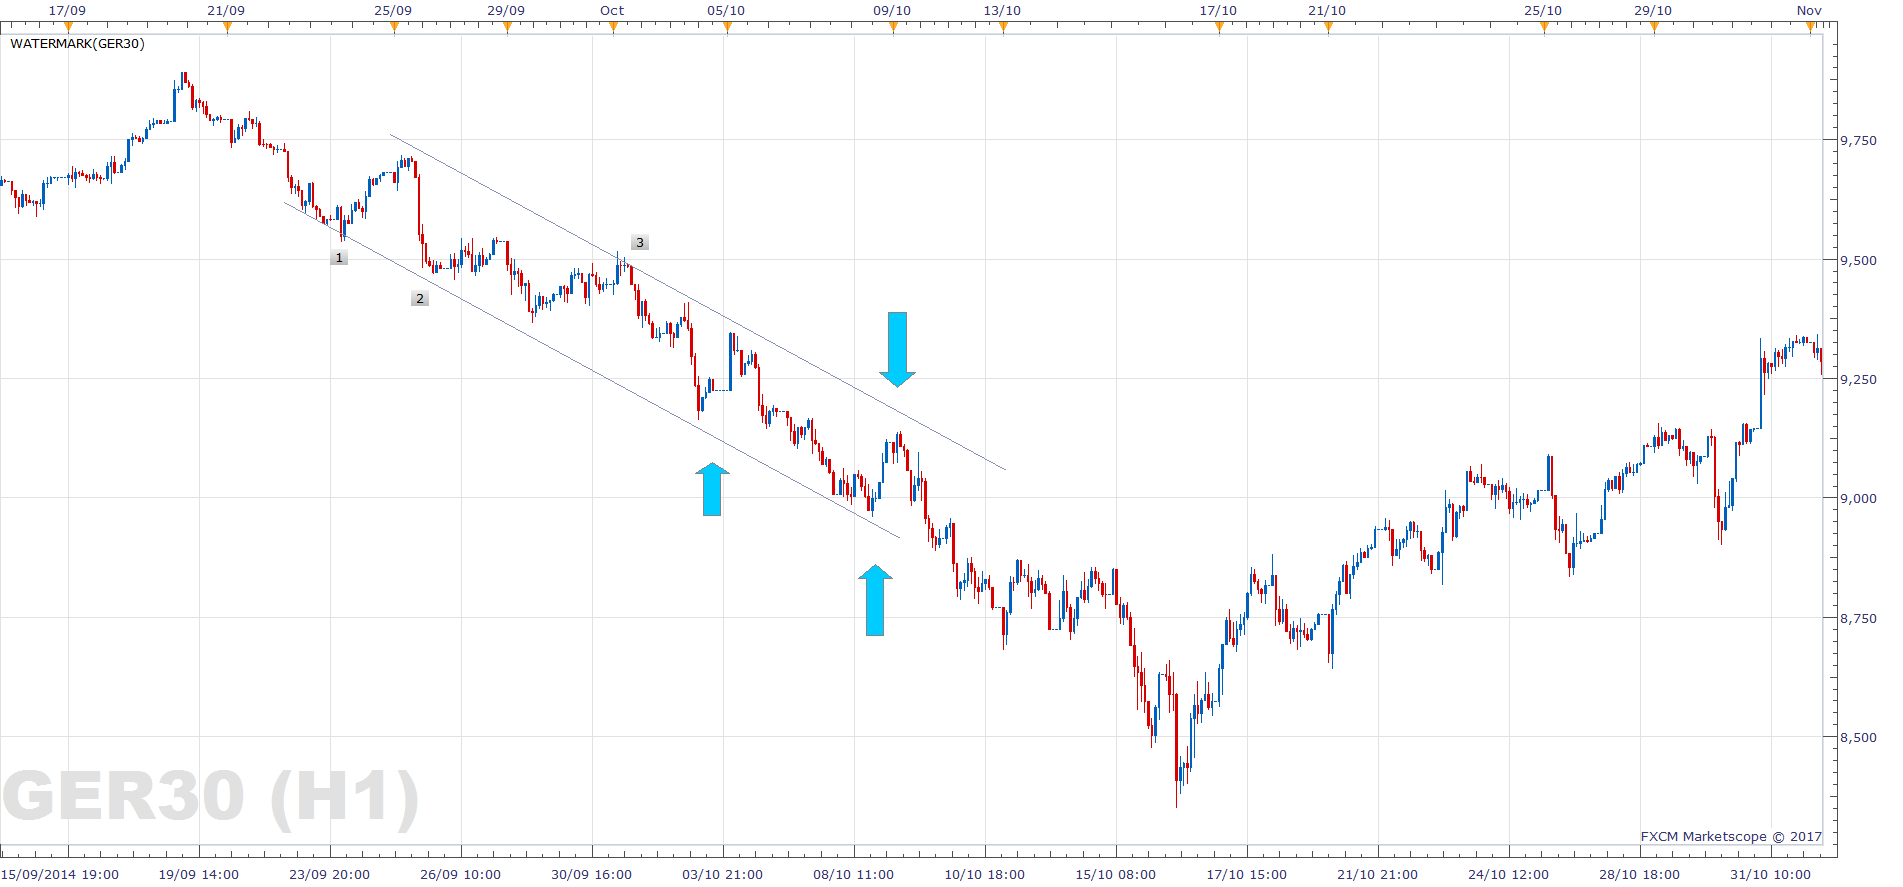
Trend Channels
Finally, in our introduction to DAX support and resistance, we come to trend channels. These can form a very simple strategy for a trade as the price can respect these levels. When the price bounces from trend support and reacts at a parallel level above, it forms a channel. This is known as a price channel. Price can often bounce between these levels. A very basic strategy is for traders to look for selling opportunities around DAX resistance and buying opportunities around DAX support.
A trend channel on the German DAX that has a positive direction, is often referred to as a Bull Channel. A trend channel that has a negative direction, is often referred to as a Bear Channel.
DAX Support and Resistance Summary
There are many types of support and resistance, but in this introduction article, we cover off just a few of the main ones. Open up a German DAX chart and see how many examples you can find.