
When I first started trading I would constantly ask myself about how the DAX moves. I mean, more specifically, I was asking myself what are the mechanics, behind the scenes, that the cause price movements?
I just could not get my head around it. But then I would still ask myself a week later and still have this unsolved mystery in my head.
If you have struggled with a similar question, then this article should hopefully answer that for you too.
Although then article focuses on the DAX specifically, it would be true for any financial market.
In order to answer this question of how the DAX moves, we should probably understand the DOM.
Depth Of Market (DOM)

For those not familiar with a DOM, it is an acronym that stands for Depth Of Market.
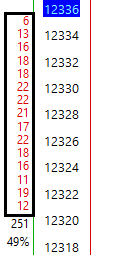
On the left of the article you should see an image.
This image is an example of the DAX trading DOM, taking from my Sierra Charts platform.
What the image shows, is a series of prices in the middle column, then the number of contracts being offered to buyers or to sellers, on either side. All these numbers on the left and right are limit and stop orders.
On the right hand side, you can see the number of contracts ordered above current price in green. These folks are traders with an order on the market willing to sell at these particular prices.
On the left hand side, you can see the number of contracts ordered below current price in red. These folks are traders with an order on the market willing to buy at these particular prices.
Let’s get a bit more specific with Ask Quantity and Bid Quantity.
 Ask Quantity
Let’s use the image on the right. These numbers are displaying the Ask Quantity or Offer quantity. To get this image I have simply focused on the green numbers on the upper right hand side of the previous image.
This new image displays the seller’s orders. It displays the ask quantity on the order book.
Let’s use an example. We can see at 12338 there are currently 18 contracts on offer.
This means that the sellers, right now, are saying “The price is currently too cheap to sell, but if you’re willing to pay me 12338, I will sell you up to 18 contracts, right now!”
Bear in mind, that these numbers are constantly changing.
The numbers are constantly changing because deals are made quickly. But also because orders are changed or removed by traders as their ideas change.
But right now, at this moment in time, you have 18 contracts on offer at that price.
Another example, let’s pick another price point, 12340. Here you have 14 contracts on offer at 12340. So if you’re willing to pay that 12340 price, which is higher than the market value, then the sellers will sell to you right now.
So that’s the ask quantity covered. What about the bid quantity?
 Bid Quantity
Let’s use this new image (on the left). These numbers are displaying the Ask Quantity or Offer quantity. To get this image I have simply focused on the red numbers on the lower left hand side of the first image. This highlighted area displays the bid quantity.
For example, at the 12334 price, there are people saying “The current price is too expensive, but I will buy from you, if you sell to me at 12334”.
So they are expressing that they don’t want to pay the last traded price (the current price of 12336), but they will pay 12334.
Let’s see another example. There are 13 contracts at the 12334 price. Another way to say this is that there are 13 contracts ‘on bid’.
Therefore this DOM shows the order book. It shows the ‘interest’ that is sitting in the market, right now and this is the depth of the market.
Great, But How Do Trades Transact?
Stay with me. I’ll get to that. Allow my creative freedom here, because I am over-simplifying the process by demonstrating that a tick is one point. It isn’t always one whole point. For this example, I will assume that it is.
Staying with this same example, right now, the last traded price is 12336.
We know that there are 16 contracts on offer (right) at 12337 and there are 6 contracts on bid (left) at 12335. But none available at 12336.
So currently, there is no way for those two sets of traders to meet.
These orders are at different prices and neither side wants to pay the other side’s price. So we have a stalemate here. Sellers want a higher price, buyers want a lower price. Neither side can agree.
So what needs to happen?
Something has to happen for the next trade to occur.
Both sides are patiently waiting for the other side to compromise and change their price so their orders can be filled, right?
Well, as there is no way for these two orders to meet, then the only way for a trade to happen, is for a market order to come in. So one side, either the buyer or the seller, needs to be aggressive.
For example a buyer has to come in thinking “ok, as I don’t think the market is going to come down to my order, but I still think the market is going to move higher” and therefore say to a seller holding their order: I will pay you your 12337 right now”. The buyer is taking the initiative and being aggressive.
If that happens, the next trade will occur at 12337. Which is one tick higher than the last traded price of 12336.
By contrast, a seller may be more aggressive and go up to a buyer thinking “I think the price is going to come down, but as I don’t think it’s going to come up to meet my ideal price” and therefore say “I will sell at your 12335 right now”. This time the seller is the one taking the initiative. If that happens, then the next trade market will occur at 12335. Which is one tick lower than the last traded price of 12336.
Therefore, during these deadlocks, as soon as one side becomes more aggressive, the deadlock is broken and the market will move by a tick. The process repeats. We have just looked at one example. In reality, this can happen hundreds of times a second, depending on the liquidity and supply and demand in the market.
The key point here is that if people believe the DAX is about to move in their direction, but not going to meet their order first, then they are placing market orders and are being aggressive.
Why is Aggression Important?
Because we are able to see aggressive buying and aggressive selling by examining where that trade occurred.
Most good charting platforms (with a relevant exchange data feed – such as a Eurex feed) will allow us to see where the trade occurred on the exchange. We won’t cover exchange feeds here in this article. But just remember that a CFD broker’s volume data is not what is actually happening on the market.
Final Thoughts
Let’s look again at the DOM. And grant me creative freedom here, because I have rounded this up to be full point ticks, that is not always the case. A tick is not always one whole point.
We now know that if the next trade was at 12337 (the offer price) then this is an aggressive order to buy. The buyer was not willing to wait for price to come down, they wanted to take a position now. The buyer was more aggressive than the seller. Aggressive buying. This is an example of a market order that went off at the ‘ask’ price.
If we look at the reverse example, if the next trade goes off at 12335 (bid), then that was a seller that does not think the market is going to come back up. They wanted to get in. They are willing to accept less for their sale and as a result, they are being more aggressive than the buyer. Aggressive selling. This is an example of a market order than went off at the ‘bid’ price.
It’s really important that you understand this. If a trade went off at the Ask, then it was an aggressive buyer. It was an example of someone not willing to wait for the market to come down first. If a trade went off at the Bid, then it was an aggressive seller. It was an example of someone not willing to wait for the market to go up first.
In Sierra charts, there is a study called ‘Numbers Bars’ that will show us this information. It is a complex and detailed study, which is great for anyone who has an interest in studying order flow. But before you play with order flow techniques, which we do, a lot, you have to understand the basics of how the DAX moves.
I hope you now understand it better. Leave your comments below, if you feel that this article helped you.


