In this unit, we’re going to look at the DAX Head and Shoulders Pattern (regular and reverse). These patterns help us show that the momentum needed to break a resistance level or a support level is currently not there in the market. But once the momentum arrives, we can anticipate how far the market will move.
Last time, in the previous unit, we looked at the double top pattern and the double bottom pattern. We now know that these two charting patterns show the momentum needed to break support (double bottom) or resistance (double top), is not there in the market. So when this happens, traders look to trade a reversal of the trend.
You will get a good basic understanding of these two patterns during this unit. We are then going to look at a specific strategy with exact entry and exit points. This will help you really understand how it translates to the Dax and. Once you understand the strategy, you can begin trading them.
DAX Head and Shoulders Pattern
We define a DAX head and shoulders pattern as one peak in the market followed by a second higher peak in the market followed by a third peak which is lower than the second peak.
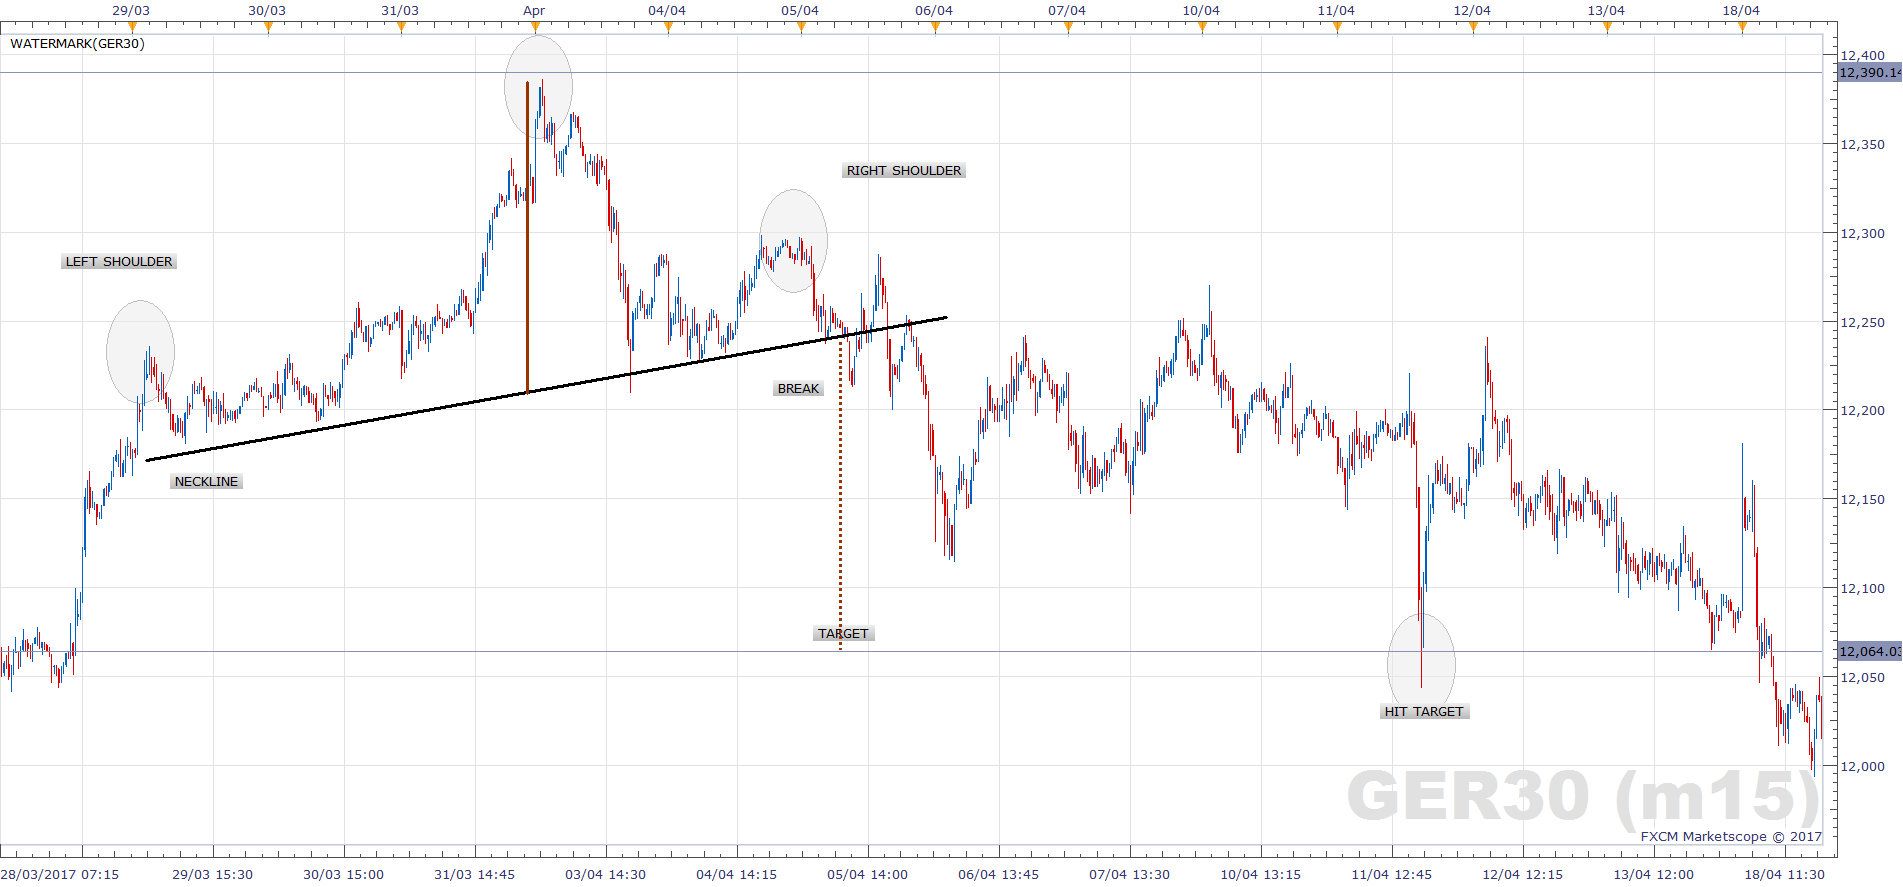
On the chart below you can see the first peak circle represents buyers being in control. They drive the market up to a certain level before sellers take back control. Sellers start driving the market down which forms the first trough (this completes the left shoulder). Buyers then take back control which runs up to the second higher peak, but sellers come back in control to complete the second trough (this forms the head). The process repeats for the right shoulder with a new peak and new trough. The pattern has now formed a neckline, which is a support level and the neckline is the low of trough one and two (the low of the left shoulder and the low of the head, joined together by a line).
The DAX head and shoulders pattern is complete once the neckline is broken. At this stage, the market will generally sell-off and from there. This is because the market tries to push up three times but fails.
Reverse Head & Shoulders
The reverse head and shoulders is basically a mirror image of the head and shoulders pattern. We define this as one trough in the market followed by a second lower trough followed by a third higher trough.
Here you can see here the first shoulder forms with sellers in control driving price down into the first shoulder but buyers take back control. This forms the first peak of the pattern. Sellers take back control forming the head of the pattern, buyers back in control forming the second peak. Finally, sellers are back in control to form the second shoulder of the pattern and you can see there the neckline.
This time and traders look for a break of that neckline which confirms the pattern is in place and has completed. Now you can see the resistance levels on the head and shoulders pattern. So in summary, the market is failing to break support and so after it’s failed three times at three different levels buyers will be in control. Notice how the previous article on support & resistance is important.

Advanced Head & Shoulders Tip
These images are just basic examples, but to maximise the effectiveness of trading this pattern lookout for these two important things:
- The neckline for a regular DAX head and shoulders pattern should point down. This indicates falling bullish momentum and increases the probability of a bearish reversal. The opposite is true for the reverse head & shoulders pattern/ The neckline for a reverse head & shoulders pattern should point up. This indicates falling bearish momentum and increases the probability of a bullish reversal.
- Watch for falling volume on each consecutive peak (and vice verse for reverse head and shoulders). The left shoulder should see the most volume, the head should see less and the right shoulder less again.
- The higher the timeframe, the better the opportunity.
Trading Strategy – Regular DAX Head and Shoulders
Just remember that the examples I have used above are not optimal. They are just recent to the date at which this unit was written. Remember also to always check the advanced tips. So when you find setups, it will provide a bit more strength to the analysis.
- Wait for the shoulder, head and shoulder to form
- Draw the neckline (trough of the left shoulder to trough of the head)
- Measure distance between head and neckline
- Check the slope of the neckline is down
- Check the volume for each section (decreasing for every three parts)
- Wait for a break of the neckline
- Check that volume has INCREASED on the neckline break
- SELL- your entry is the neckline
- Target – the distance between the head and the neckline
- Stop loss – above the head
Trading Strategy – Reverse Head and Shoulders
- Wait for the shoulder, head and shoulder to form
- Draw neckline
- Measure distance between head and neckline
- Check the slope of the neckline is up
- Check the volume for each section (decreasing for every three parts)
- Wait for a break of the neckline
- Check that volume has INCREASED on the neckline break
- BUY – your entry is the neckline
- Target – the distance between the head and the neckline
- Stop loss – below the head
There you have it. Go open up a German DAX chart and find some examples for yourself and have a great trading week.