Welcome to the DAX MACD technical indicator introduction. In this unit, we will look at how the indicator is built using moving averages and why it is one of the most popular technical indicators.
MACD is pronounced “Mack-Dee”. This is an abbreviation (more specifically an acronym) of Moving Average Convergence Divergence. MACD is a momentum indicator that uses a combination of moving averages to provide DAX trading signals.
One of the advantages of using the DAX MACD indicator instead of the regular moving averages is that the MACD gives you an indication of what’s happening with momentum. The MACD indicator has standard settings and most charting platforms have the same default levels.
Now at this stage, I realise just how many components the MACD has and it’s a challenge to simplify it, but let’s try.
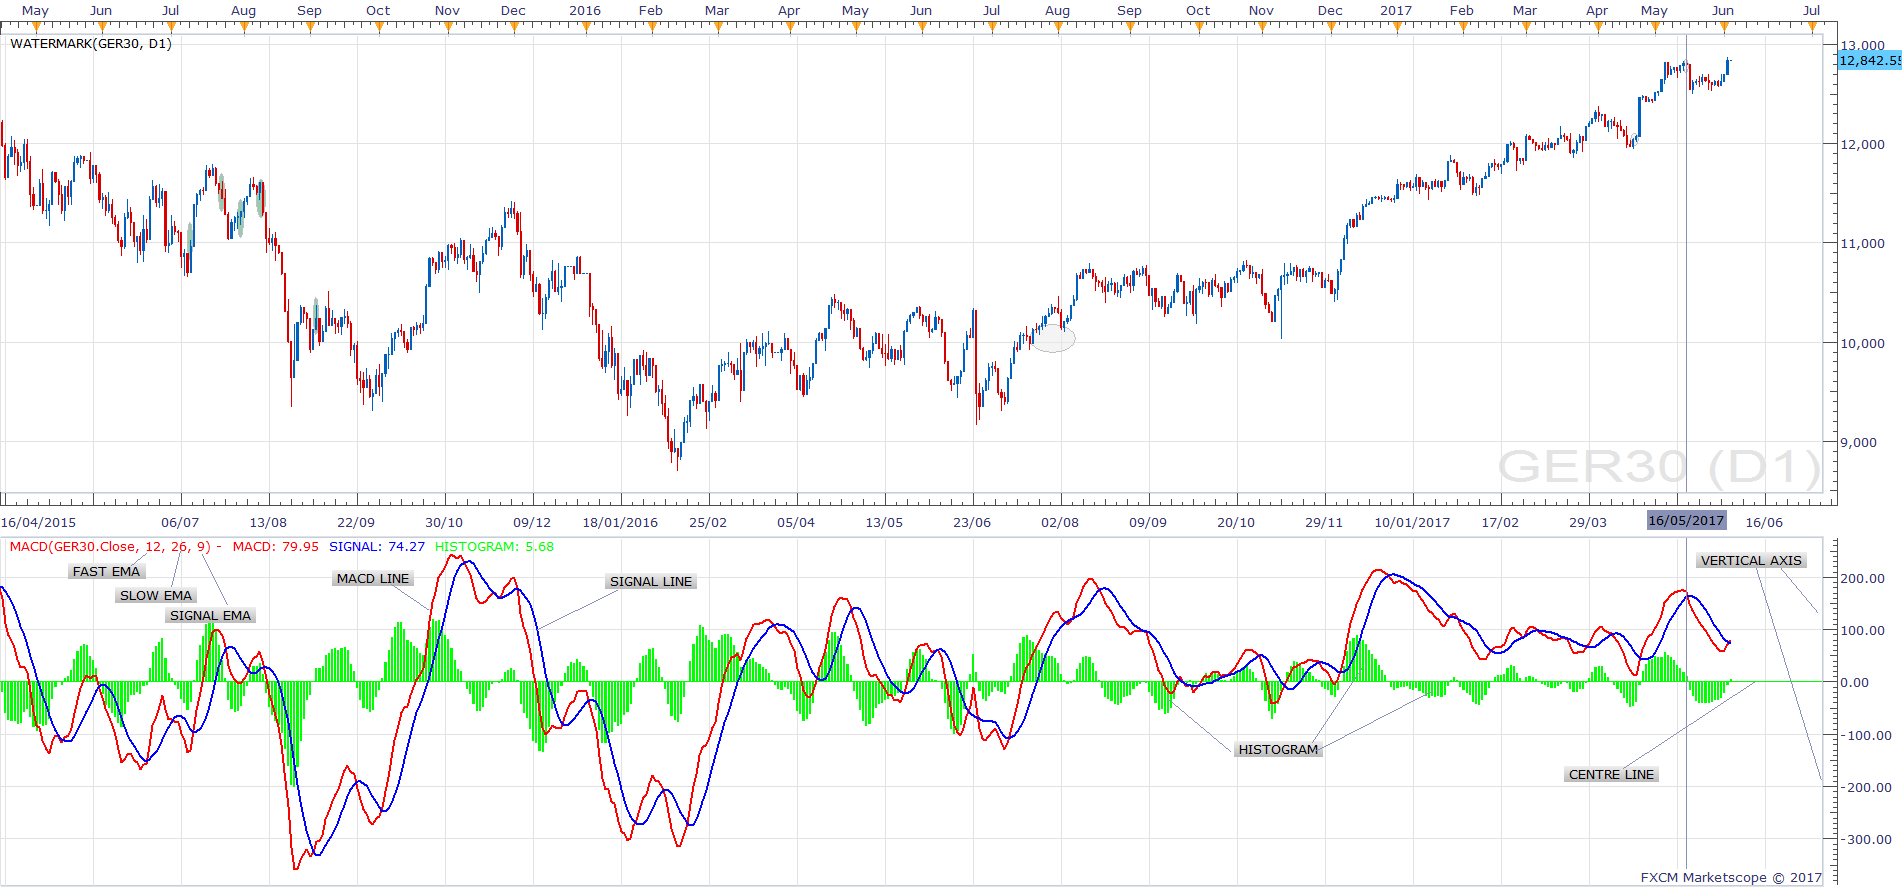
DAX MACD Components
- Fast EMA (default is 12) – Slow EMA (default is 26) – The Signal EMA (default is 9)
- MACD Line
- The Signal Line
- The Histogram
The centre line is also called the zero line, it’s an important additional component. This is the horizontal line on the indicator and is used as a reference for momentum changes. The changes in momentum can be measured using the scale on the vertical axis on the right.
The default indicator is constructed by subtracting the Fast EMA from the Slow EMA. The resulting line is then plotted below the price chart, this is called the MACD line. The MACD line fluctuates above and below a centre line which is placed at value zero on the vertical axis. Then a 9 period EMA of that MACD line is plotted too. This is called the MACD signal line. It can provide trading opportunities which we will look at later. The histogram is the difference between the MACD line and the Signal line. So the MACD histogram is almost an indicator of an indicator of an indicator. Confused? Don’t worry, visually it will start to make sense, see below.
MACD Line
When the see the MACD line is above zero, this tells us that the 12-period EMA is trading above the 26-period EMA. When the DAX MACD line is below zero this tells the trader that the 12-period exponential moving average is below the 26-period exponential moving average. As traders, we should watch the MACD line and when it’s above zero and rising we’re going to look at this as a sign of positive bullish momentum. When it’s below zero and falling we’re going to look at this as a bearish sign for the market. You can see a couple of examples on the chart above where the MACD line is above zero and rising and that is bullish. You can also see when it is below zero and is falling, then that it is bearish.
The Signal Line
The purpose of the 9-period EMA is to smooth the MACD line and produce a signal line. This line is also plotted on the indicator. When these two lines cross each other, that can produce a signal. When these two lines both cross the zero line, that can also produce a signal (as seen below). We can look at strategies a bit further into this unit.
Histogram
Most charting packages will plot a histogram which is representative of the distance between the MACD and its signal line. When the MACD histogram is above the zero line, this is an indication that positive momentum is increasing. Conversely, when the MACD histogram is below the zero line this is an indication that the negative momentum is increasing. So that is a crash course in understanding the different components of the MACD.
Trading with MACD
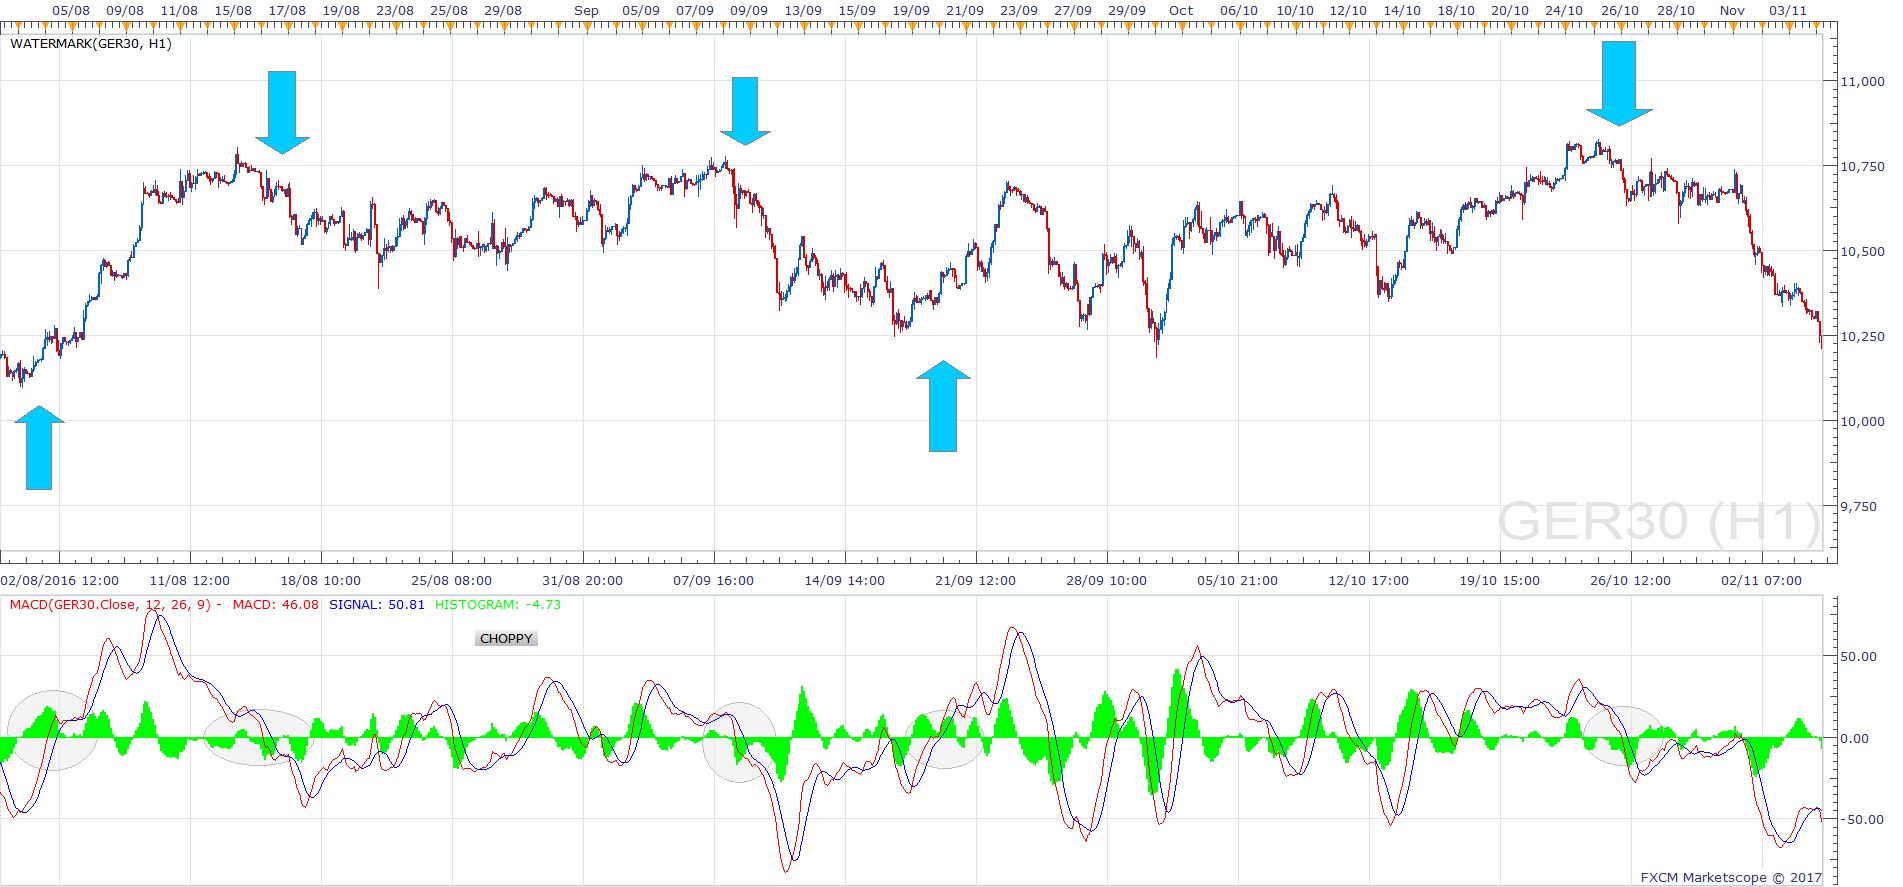
The MACD indicator is a trending indicator, so we are going to shy away from using it when the markets in a range. There different ways that you can trade the MACD. One of my favourite methods is called MACD divergence
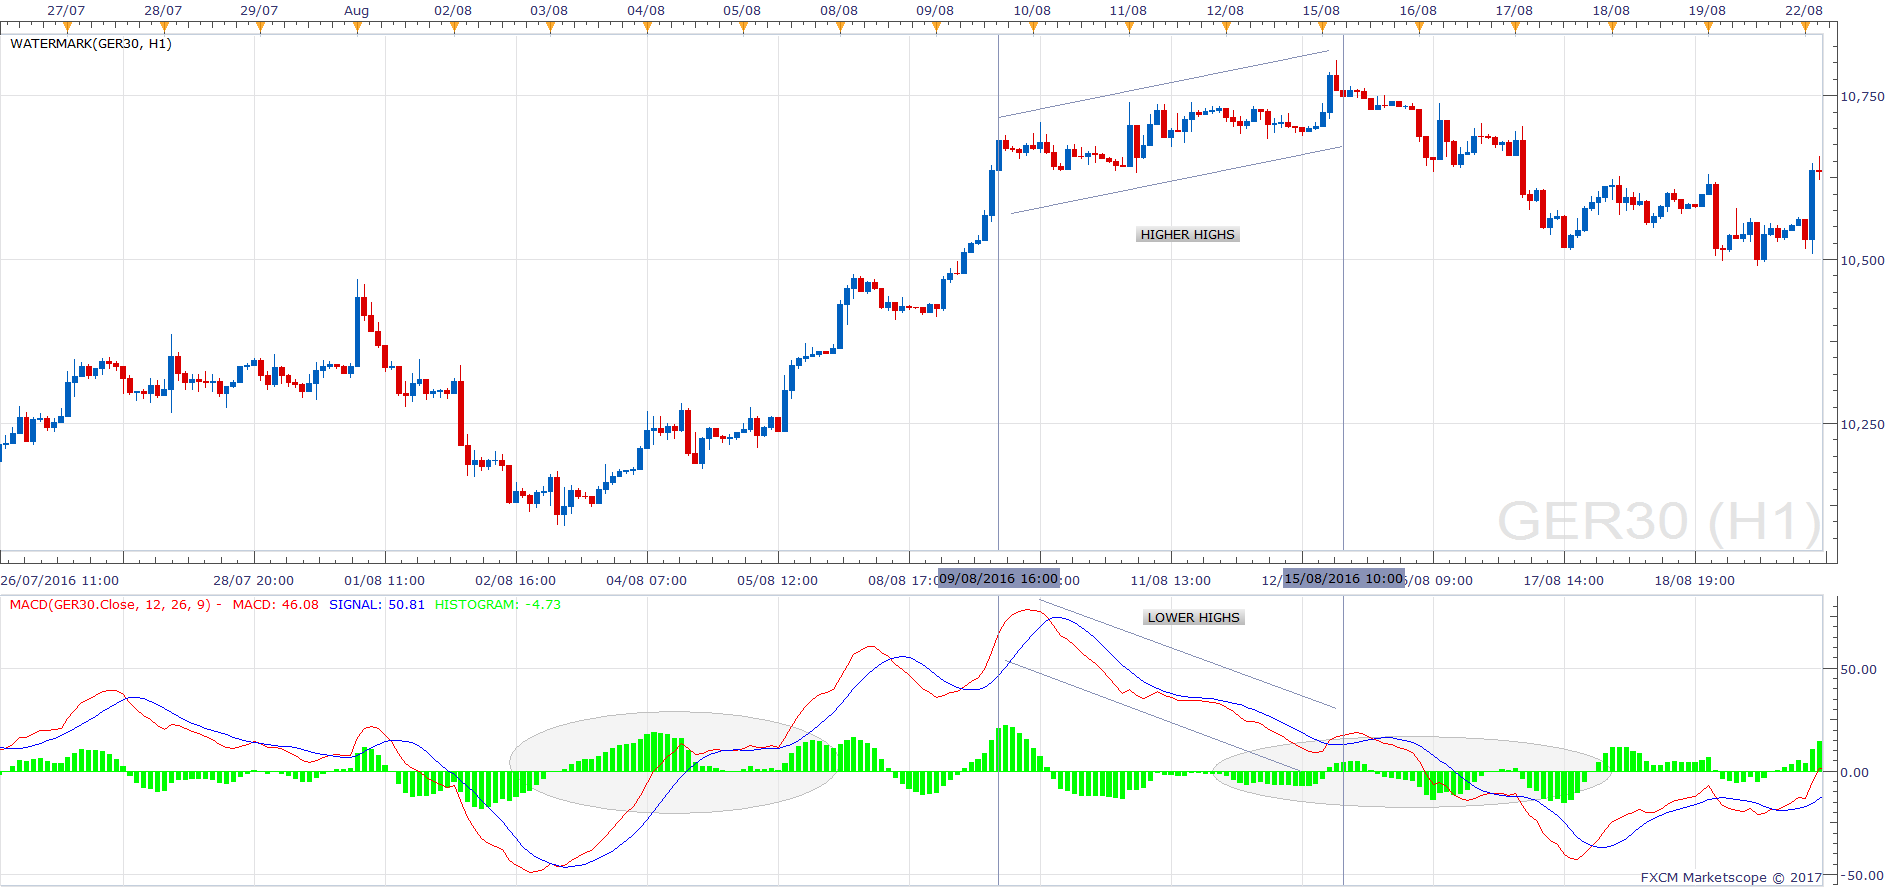
MACD Divergence
We want to look for situations when the DAX MACD indicator is trading in the opposite direction of the DAX. It is a signal that the trend may be due for a reversal. You can see below that the market is making new highs. However, the MACD is actually trading down and that’s an indication that that trend is running out of steam. The opposite would be true. So if it was a downtrend and the DAX MACD was trading up, that would be an indication that the downtrend was losing steam.
But in this example below, we have our uptrend and we can see here by looking at the MACD that the uptrend might be in danger. You can see the market did sell-off. all the other indicators that we’re going to look at you’re going to want to use this in conjunction with some of the things that we’ve learned so far you
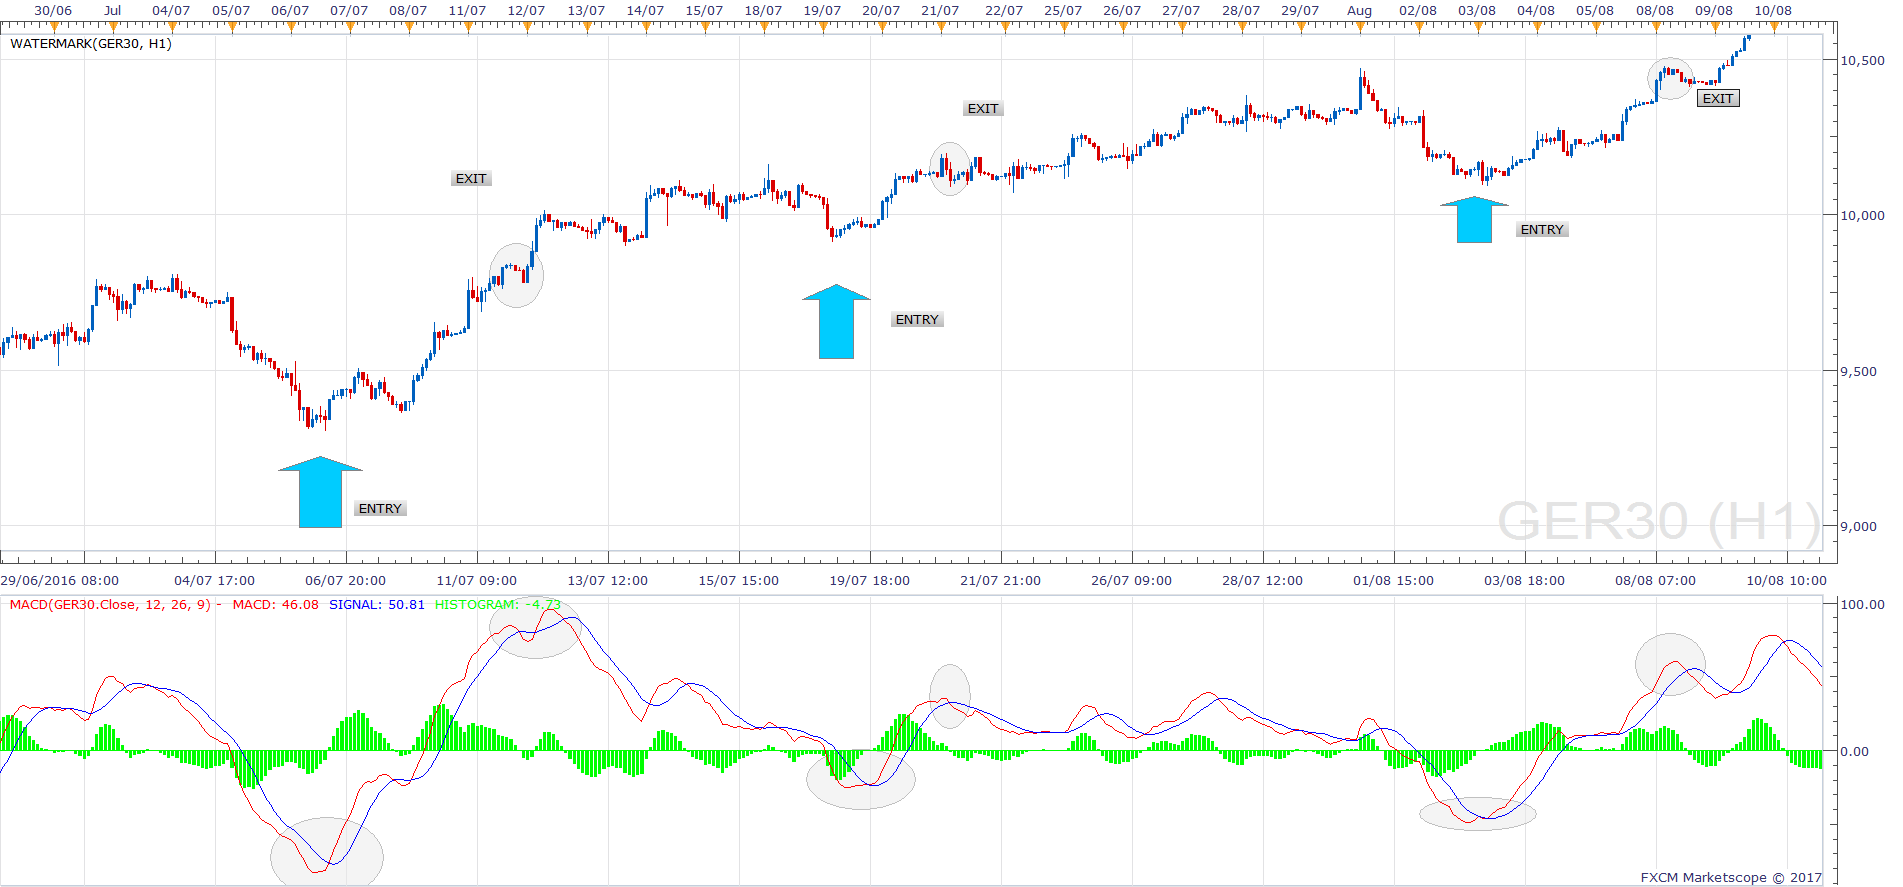
The MACD Crossover Strategy
This happens when the MACD line crosses above the signal line this is a bullish sign. We will trade this as a buy signal and when it crosses below the signal line then that is a sell signal and German DAX traders will look to go short (or exit their long positions).
This can be traded by itself, although not recommended. It’s recommended to trade it in line with some other indicators. This strategy is most effective as a confirmation tool. So in the example below, let’s assume we know the market is in an uptrend. We only want to buy in this situation so using the DAX MACD crossover, you can see a couple of great buy signals. We keep the trade running until the reverse signal is there. Be aware that the MACD is a good indicator but it is one that is going to generate a lot of signals. Sometimes it will generate a lot of bad signals in addition to the good ones.