Now that we have a better understanding of technical analysis, the next thing to study is charting patterns, starting with the DAX double top and the DAX double bottom. Charting patterns are what many technical traders look for on historical price charts. This is because traders get a feel for what the current supply-demand situation may be. Charting patterns are interesting because we can look at how to make trades as a result of them. This article will take a look at some of the most popular basic chart patterns.
In our previous articles on support and resistance and trends, we went over some of the most basic chart patterns. For example, uptrends can identify potential buying opportunities. Downtrends can identify potential selling opportunities. Now although support and resistance aren’t classified as chart patterns, there are many chart patterns which associate with identifying support and resistance. It’s important to identify support & resistance and potential levels where you might want to place. Let’s take a look at the double top & double bottom individually.
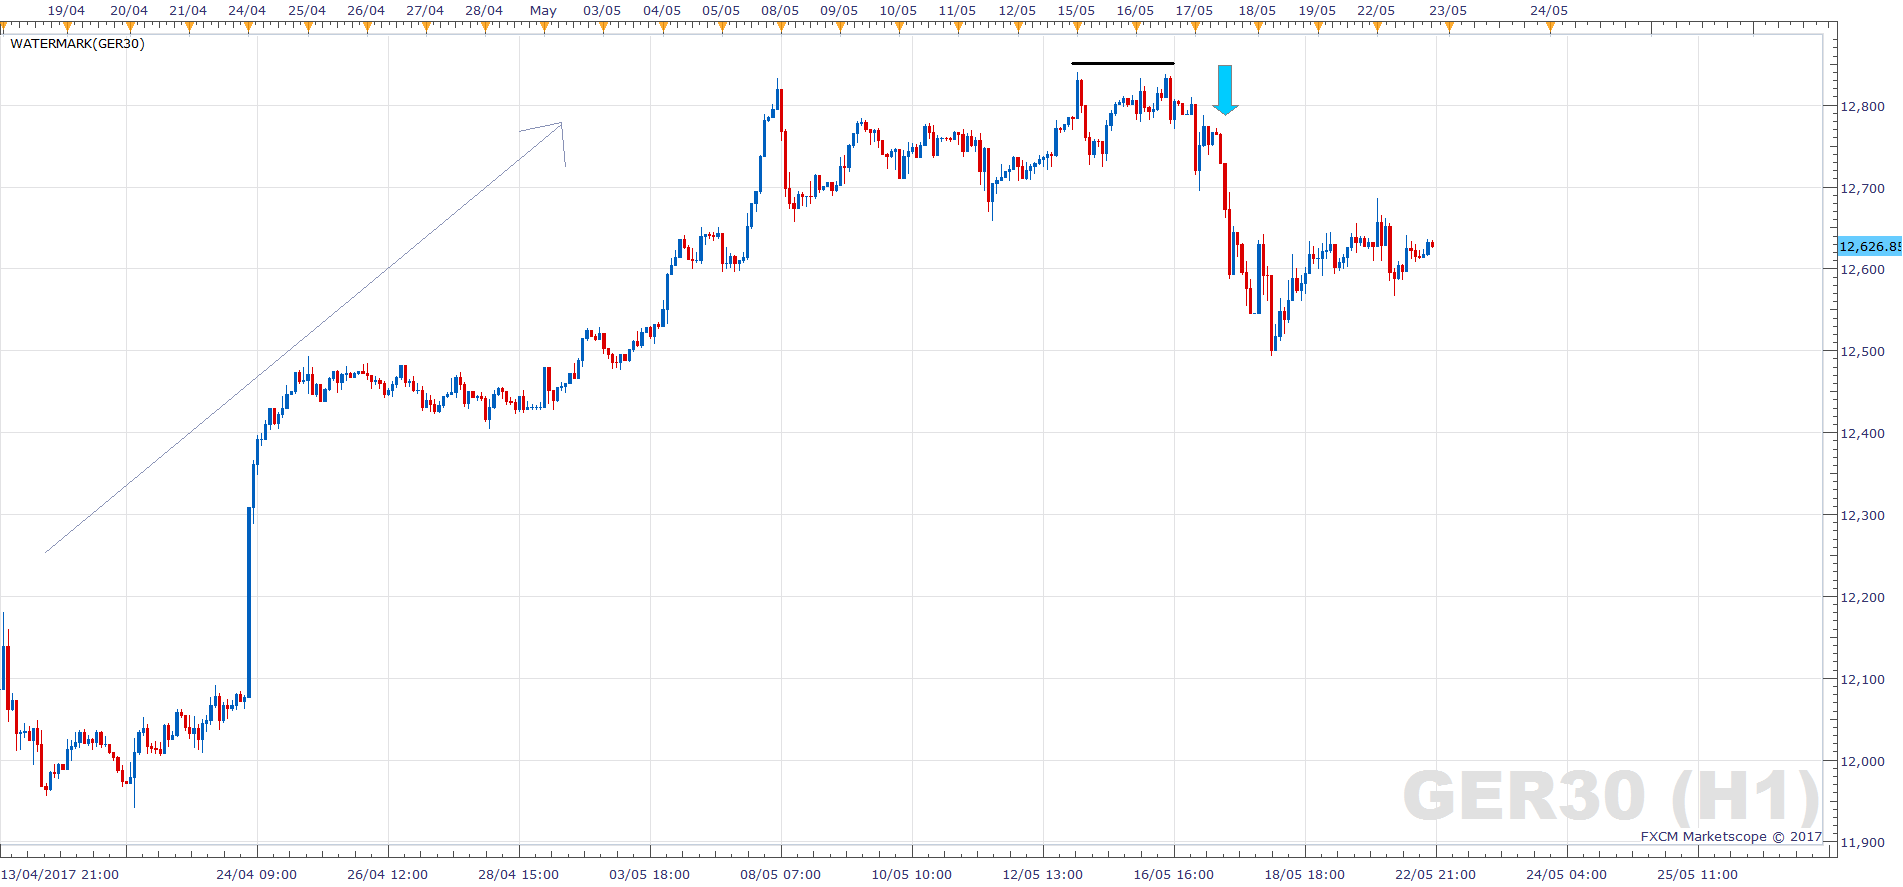
DAX Double Top (DT)
The DAX double top pattern is particularly potent and compelling when they are at the top of a trend. I say this because they’re considered a reversal pattern. So basically buyers are making a run to a specific level which forms the first top. Next up, sellers take over as buyers are unable to push through resistance. Price falls so buyers regain control to make a second run, but again, lose out to sellers. At this stage, after losing out twice, the buyers aren’t going to step back in and therefore prices sell-off rather dramatically.
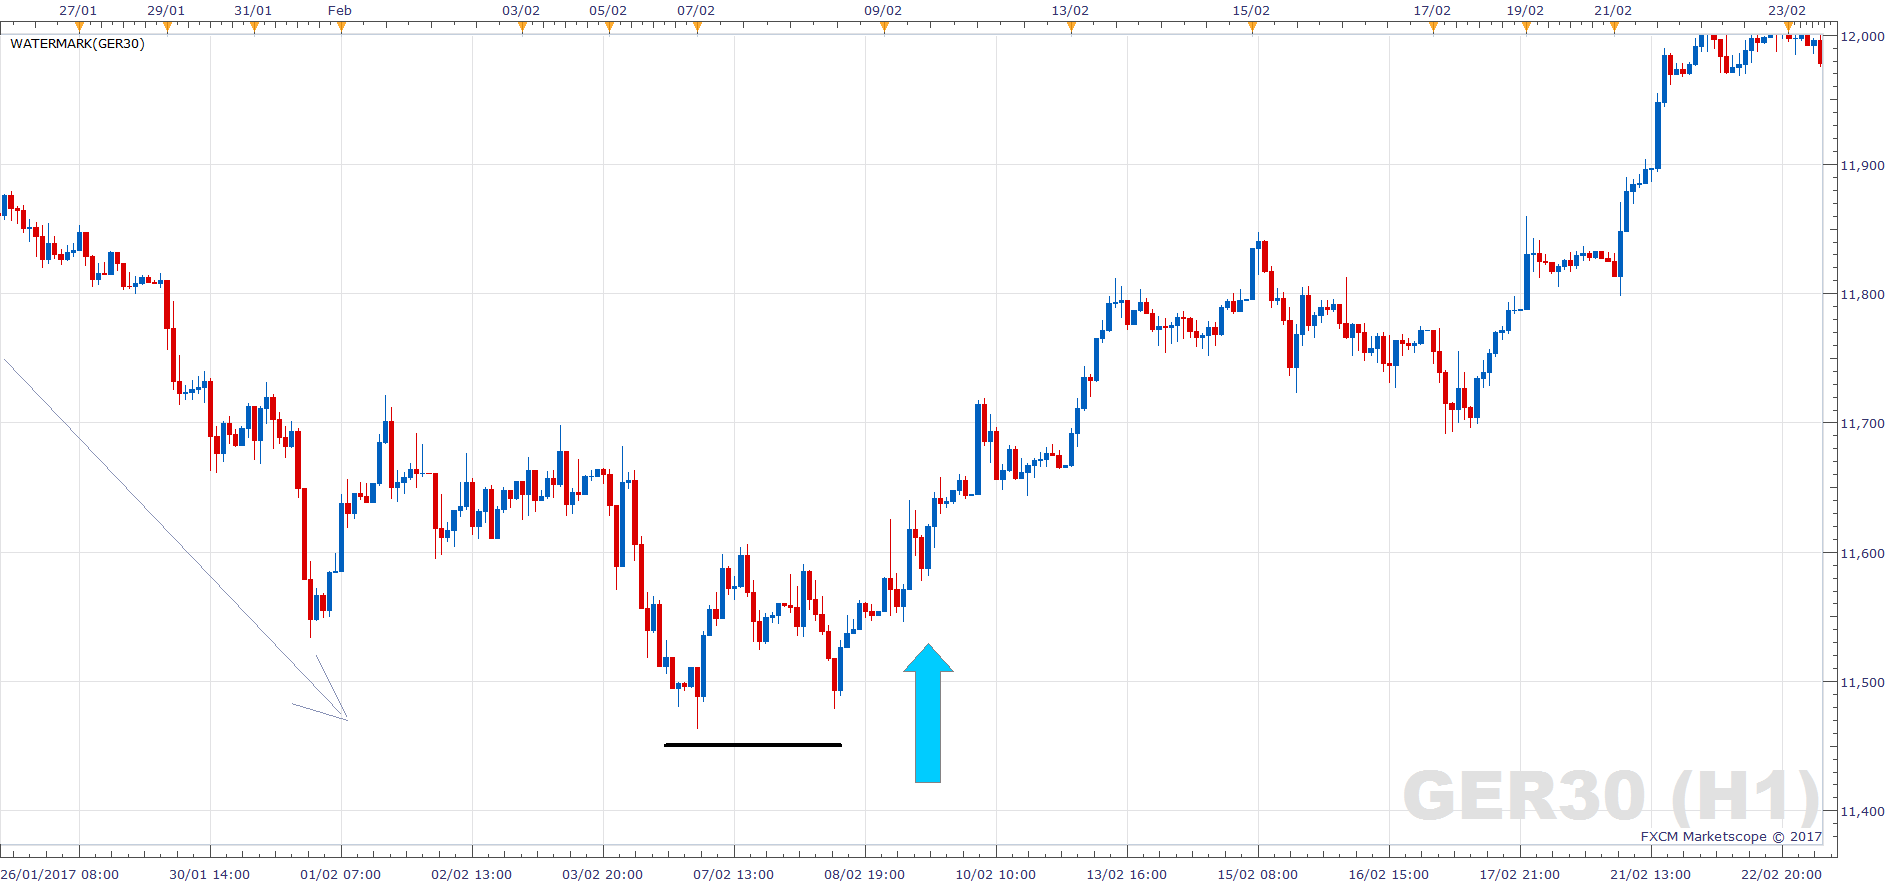
DAX Double Bottom (DB)
The DAX double bottom is pretty much a mirror image of a DAX double top. This pattern is particularly potent when at the end of a downtrend because they are a reversal pattern. Sellers can make a run for a particular level, not being able to break through that level. Buyers take control, temporarily, but lose out to a second selling run. Price does not break through this level for the second time. The theory says that sellers are not going to make a third run at it and so price should rise rather dramatically from there.
DAX DT & DAX DB Roundup
In summary, you can see from these charts how the DT & DB either shows resistance and the buyers are trying to break above that, or support with sellers looking to break below that.
So let’s take a look at a specific strategy that uses these setups or these charting patterns and let’s look at specific entry and exit points. We want to learn how to use these setups to trade the Dax. So, we know that DBs are signs that the Dax has failed to break through support. We know that DTs are signs that the Dax has failed to break through resistance. Because of this, I consider these patterns as reversal patterns. I place significance on these patterns depending on where and when they occur. For example, if I see a DT as part of an uptrend or a DB as part of a downtrend, then I am interested. This is because it is more likely that the trend may be about to end. The higher the time-frame, the better the signal.
DAX Double Top Strategy
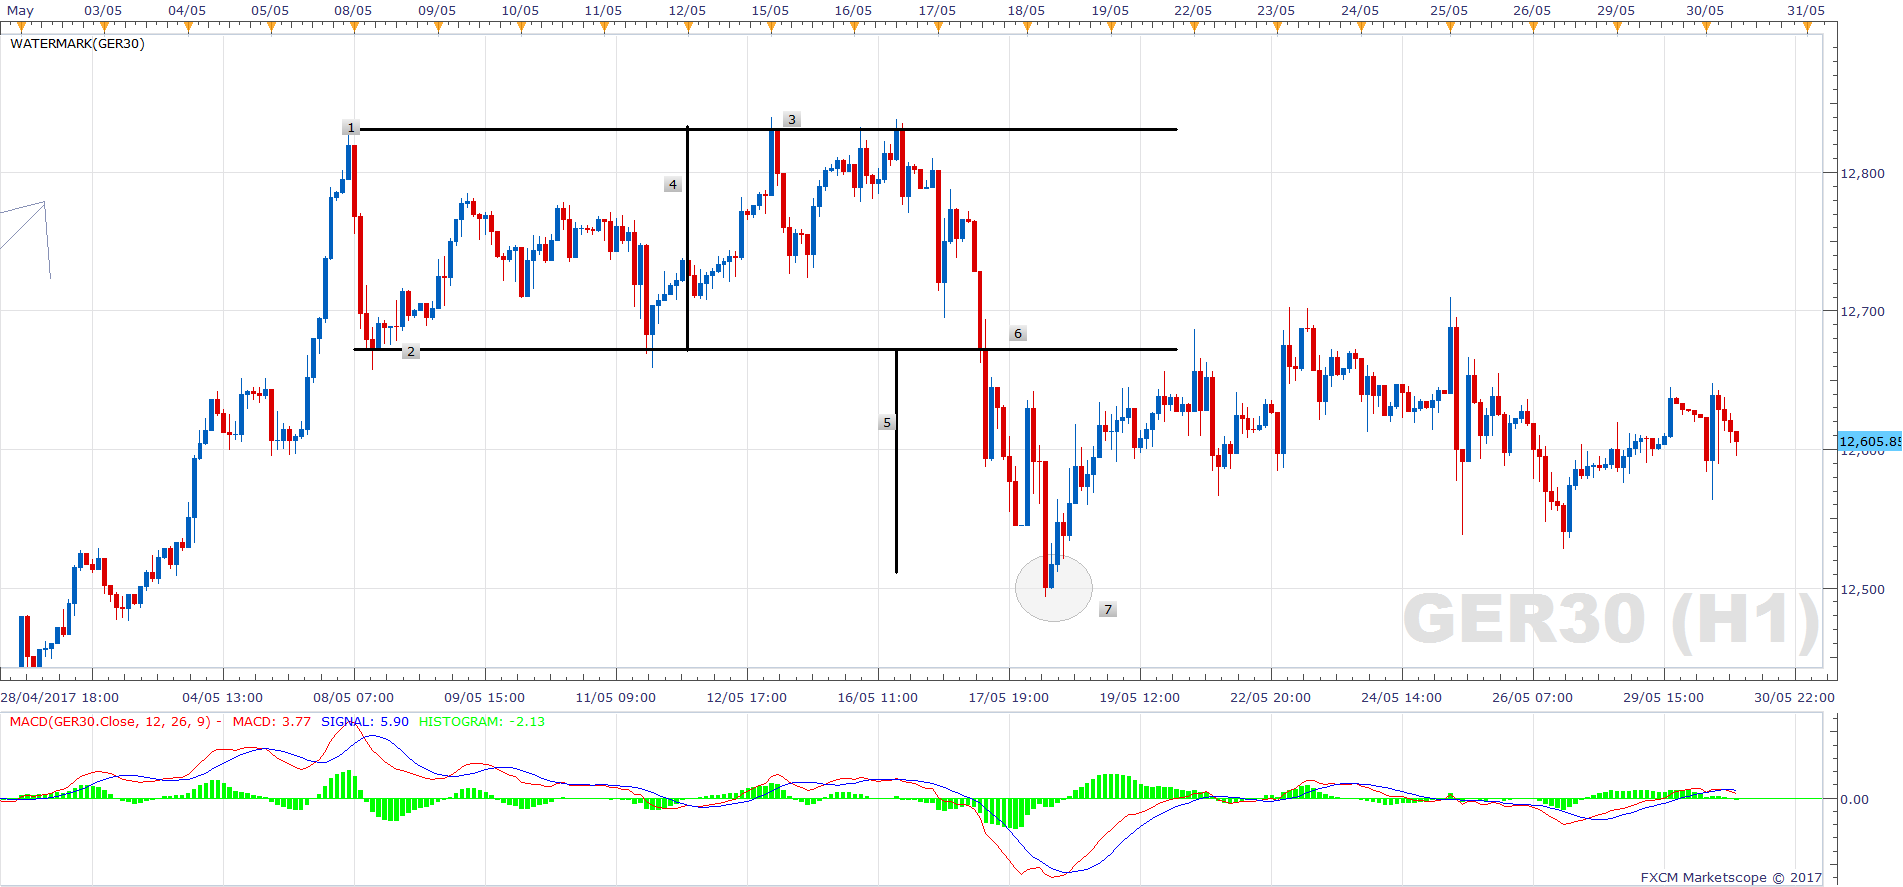
The numbers in these [brackets] refer to the numbers on the chart below
- Identify an uptrend (higher highs and higher lows)
- The next step is to spot the two major highs that appear to be a DT [1] + [3]
- Draw a horizontal (straight) line to connect them
- Find the ‘trough’ – the low in between the two highs [2]
- Draw another horizontal line at that low [2]
- Measure the distance between the two horizontal lines [4] – this distance will be your profit target
- Enter a short on a break below the low.
- Stop loss above the highs [3], profit target [5] is the distance between [1] + [3]
In this example, we would have entered a short at [6] and then hit target at [7].
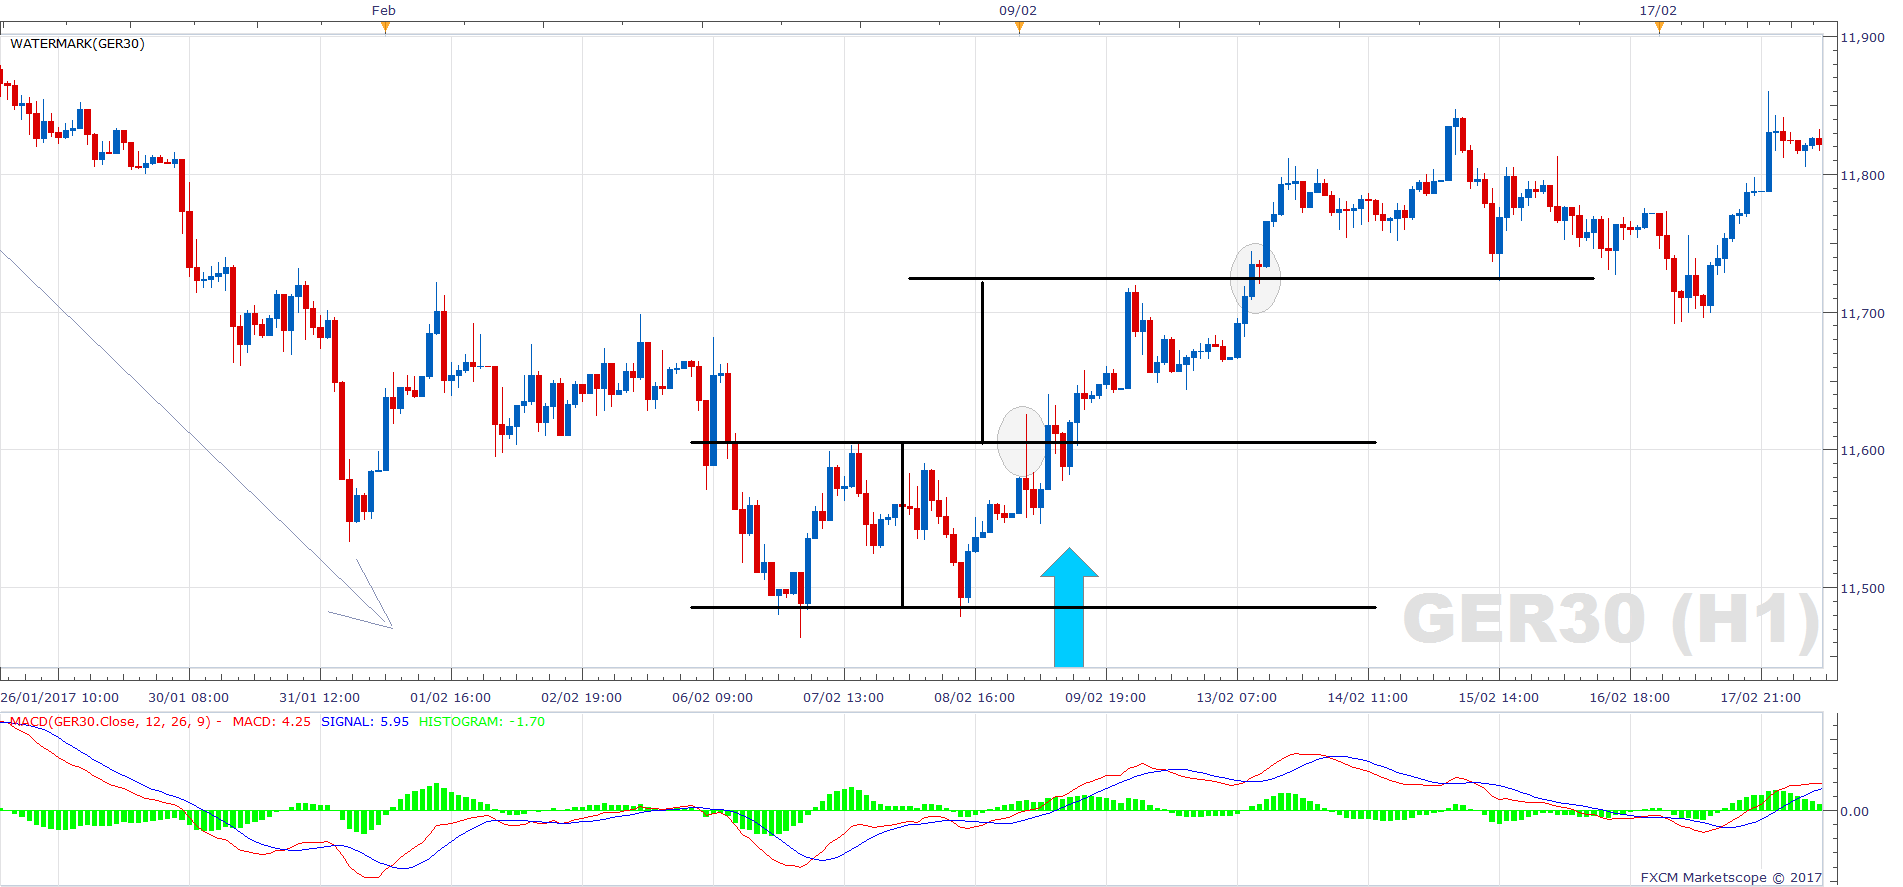
DAX Double Bottom Strategy
- Identify an downtrend (lower lows and lower highs)
- The next step is to spot the two major lows that appear to be a double bottom
- Draw a horizontal (straight) line to connect them
- Find the ‘peak’ – the high in between the two lows
- Draw another horizontal line at that peak
- Measure the distance between the two horizontal lines – this distance will be your profit target
- Enter a long on a break above the peak.
- Stop loss below the lows, profit target is the distance we measured a moment ago, beyond the peak
In this example, we entered a long on a break above 11600 and hit the target around 11720.
Wrap Up
Be careful when using the trading strategies, because they require a lot of practice. Make sure you understand exactly what you’re doing as you know the financial markets and trading, in general, is very risky. You should only trade with risk capital money that you can afford to lose. There’s no system or strategy that’s going to win all the time. No system or strategy can guarantee profits so make sure you do your homework.
For more information on how to trade the DAX, follow our DAX trading strategy.