Dax Daily Summary

Daily Dax Summary
Another day of consolidation and definitely range bound currently, perhaps steering more towards the bearish argument at the moment, but reluctant to commit until I see a breakout or an interesting candle/volume. The trade setup I suggested the other day regarding pulling back to the broken wedge/trendline support is now invalid, that opportunity has gone, but I couldn’t capitalise on it. Congratulations to those who did.
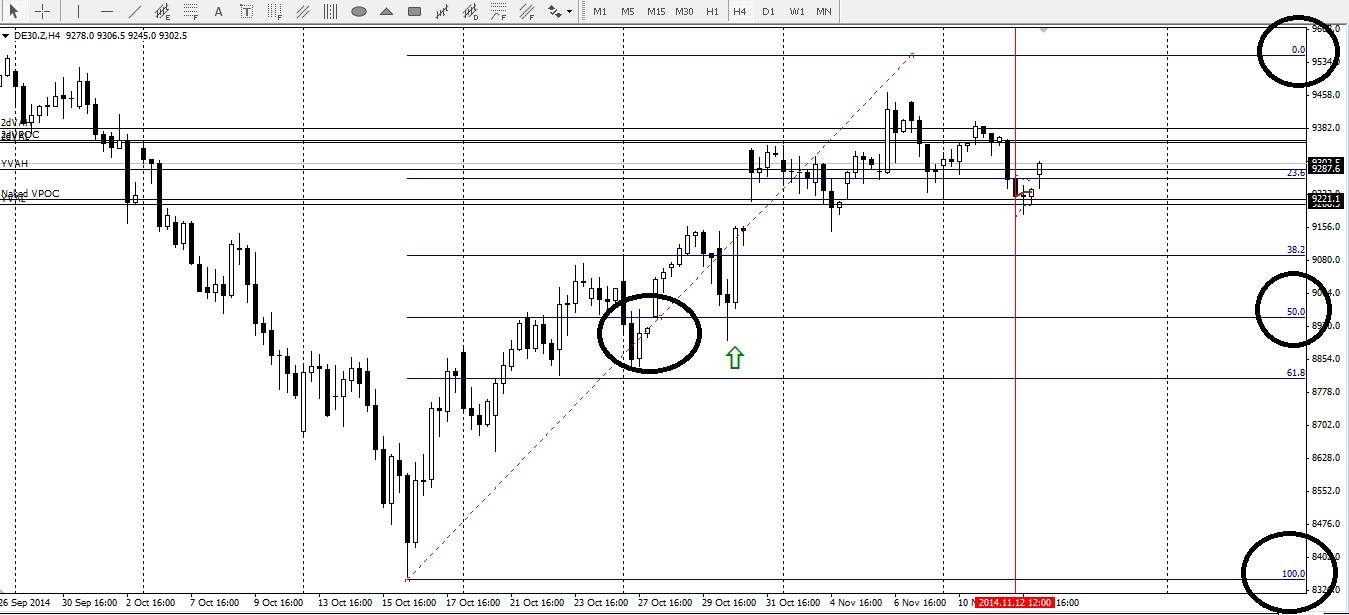
I looked at the volume profile for the last 10-15 days and noticed we have been trading around 9210-9240 quite often and these are becoming fairly significant levels (see the chart). I like the look of that to trade intra-day, but it’s not my favourite work.
Oil has plummeted again, perhaps this is going to influence the trading environments and financial outlooks for some of the Dax companies.
The SPX is an interesting chart, as is USDJPY and I have entered into a couple of trades for those.
Midday Update

Trade0065
Trading started slow, big sell off from 11GMT and over half the gains have been pared now. We seem to have found a balance point in the fib zone and will await further movement from here.
We are trapped currently in between the developing vpoc and the vwap, with a sell signal, price is currently at the 61.8 fib level and as we have pulled back from the lows perhaps here is a good entry for a further short. I have entered a small trade to test it. 10 point SL, highly unlikely to come off, but if it does there is huge reward:risk potential.
I predicted a day or so ago that we could see a pullback towards the underside of the broken trendline and a kiss goodbye to the downside again, I marked out a sell zone (red circle) and I entered a trade this morning which is first touched. I was stopped out but missed the opportunity to trade it again at lunchtime, because I was out. Never mind.
Dax Outlook Video
Dax Commentary
Balance Point
In early trading we gapped up higher and immediately pulled back to close the gap and swung around in choppy conditions. I entered into a scalp trade as the gap was closing and was stopped out almost immediately. One of those things.
My original short-term prediction from yesterday was that we were going to have a larger correction to the recent price action, but perhaps I might be swaying towards consolidation instead and look to trade a break up or break down.
I noticed on the H4 chart that we had a gap late October and based on subsequent price action you could argue that the gap could be a balance point. If that gap was the 50% point of the bull run, then you could expect a top to be around 9500. I’d be interested to see whether that holds true.
I have noticed that we have moved back inside the wedge pattern so a recovery from yesterday, but there is lots of resistance to clear to resume the upside move, so I am still going to wait and see. Long from 9200 yesterday would have been a good opportunity, but hindsight is 20/20.
Key Levels
| KEY LEVELS | |
| Daily R2 | 9440 |
| 200 Day EMA | 9342 |
| Value High | 9299 |
| Daily Pivot | 9265 |
| 24hr VWAP | 9242 |
| Naked VPOC | 9221 |
| Value Low | 9183 |
| Daily S2 | 9090 |


