[wp_ad_camp_1]
Hello traders!
I have been writing recently that we are still technically bullish, because we have been inside the bullish trend channel on the daily chart. But of course we have had some bearish warning signs recently and no more so than this morning. It started with the bearish engulfing candle on the daily chart on Wednesday followed by an inverted hammer yesterday and then continued with a gap lower this morning, which has still not closed.
So there are a couple of opportunities that look interesting. The first is a break below 9750. We have closed comfortably outside of the bullish trend channel on the daily chart and a break below 9750 could clear the way for a move towards 9500. Also if we consider the four hour chart (or hourly), then draw a fiboanacci extension from the 21/4 high to the 9/5 low back to the 11/5 high, we get an extension target of 9355, which goes down to form a double bottom. This could be an interesting target.
Bears will be thinking that once the gap closes, it may very well provide a good opportunity to short again, which could mean an entry be closer to 9875.
As far as short term setups go, a break above 10100 will allow us to resume some bullish momentum. A break below 9750 opens up downside movement. Within that range we can pull a fibonacci retracement from the recent 9930 high to the low of today and we see a 61.8% level at 9864. Shorting around here may offer good risk:reward, if we see a price action signal. Just be warned because there is bullish divergence on the 30 minute chart (RSI) which is giving a conflicting signal. I am personally not looking to trade much intra-day, given that there is a bank holiday coming, but if I was pressed to choose a direction, I would choose to short after the gap closes.
Bank holiday in Germany on Monday means that we will not have an article until Tuesday.
Dax Support & Resistance
| KEY LEVELS | |
| Daily R2 | 10184 |
| Daily R1 | 10036 |
| Daily Pivot | 9935 |
| Daily S1 | 9787 |
| Daily S2 | 9687 |
| 200 Day EMA | 10158 |
Dax Charts

02 Daily Dax Chart

03 H4 Dax Chart

04 H1 Dax Chart

05 m30 Dax Chart
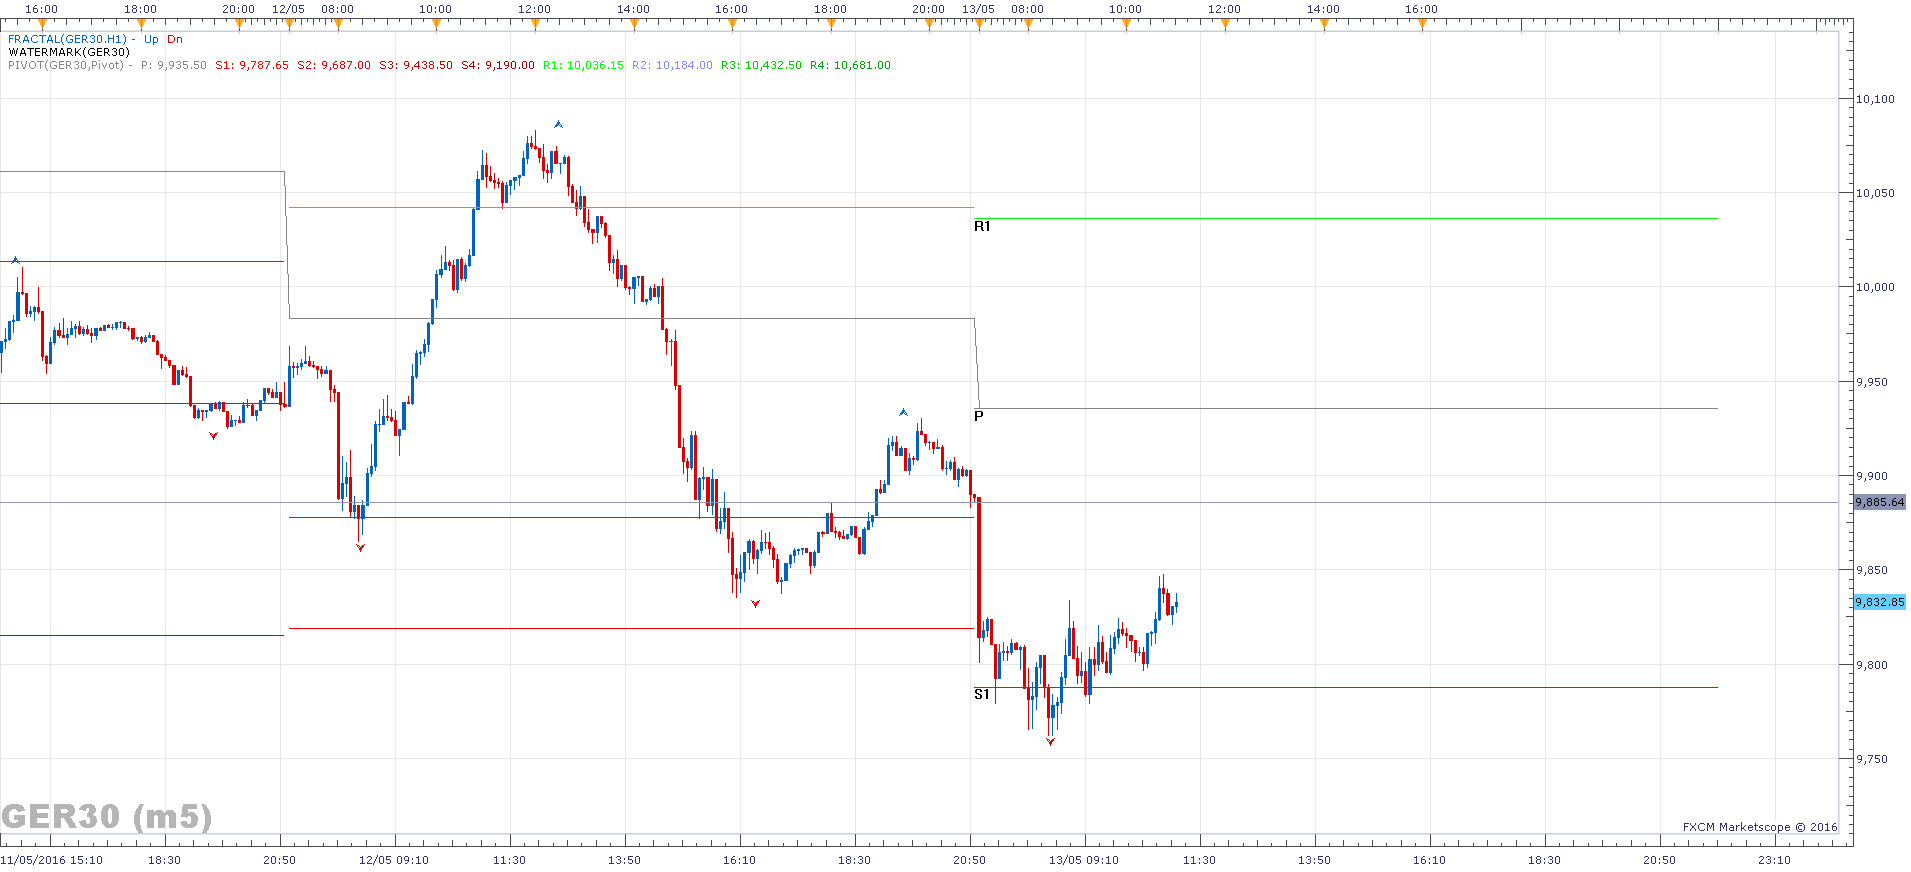
06 m5 Dax Chart


