Good morning traders!
Dax Outlook
The bearish trend defining level of 12336 is under pressure as the price continues to rally higher on easing concerns regarding NK. Buyers remain in control for the moment but the price is approaching some strong resistance. There is a shorting opportunity around 12300, assuming that the 336 zone holds and also assuming that the move continues to the downside. This level is interesting for a number of reasons.
250 Tick Chart
I like the median line on this chart. It has seen plenty of touches and price continues to react to it. Using this median line I have pulled a retracement tool from the Yesterday low, with the 50% going through point where price meets that median line. This provides an extension target (assuming the levels are valid) of 12,296. I have just noticed that the deviation high is also around this level too. So there is some confluence there.

250_Tick_Chart
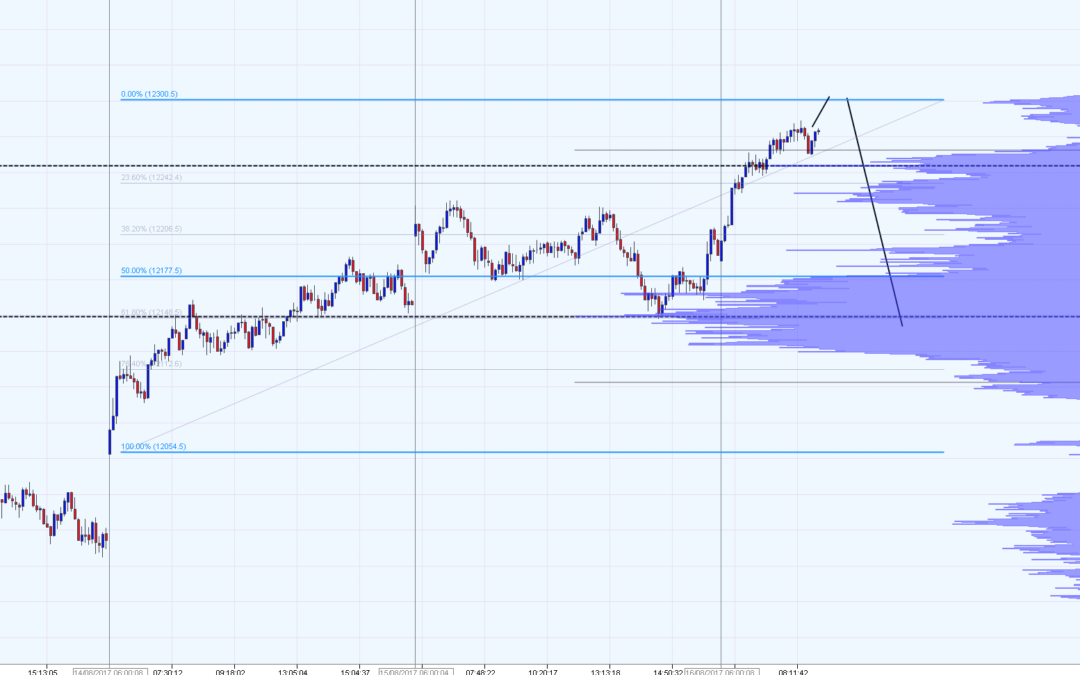
500 Tick Chart
I have a 3-week composite volume profile histogram on the right of this chart. It is showing that we have broken above the value area and are potentially heading towards the next one, which would be 12300, based on this sample of data. A familiar price zone. I have also pulled another ‘balance point study’ using a retracement tool. I have used the Monday opening price as the first point, I have used the Tuesday gap as the balance point and it extends to provide a target of, wait for it, 12300. There is an echo in here.
So based on that, my preference is to look for reasons to short between 300-336. I will keep an eye on price action, because with such a clear confluence of technical levels, it’s not exactly a concealed entry point. It would mean plenty of stop losses would be parked in that zone and what does a market maker like to target? So another plan is to short a fake break higher, which may turn out to be a bull-trap.

500_Tick_Chart
Dax Live Room
(Premium and Gold members only)
The screens are open now. Come and join in.


