[wp_ad_camp_1]
Good morning traders!
Let’s start with analysing yesterday and try and understand where we might be heading. Yesterday we printed a bearish engulfing candle on the daily chart and if we look at the last six candles, we have 4 bearish candles, 1 bullish candle and then the 1 bearish engulfing candle of yesterday all in a short-term technical downtrend. I am sure you would agree that this is a pretty bleak pattern, suggesting further bearish movement.
But a similar pattern happened at the beginning of April, 4 bearish candles, 1 bullish candle followed by a bearish engulfing candle, all of which in a short-term technical downtrend. What direction did that move go?
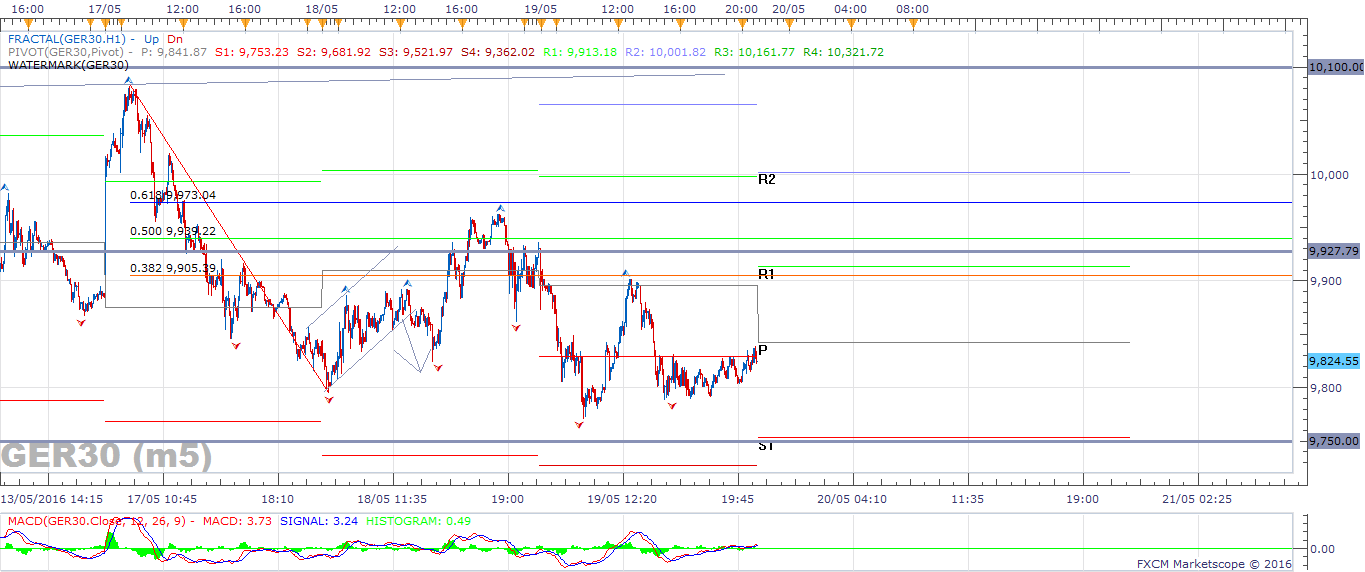
So although this is only one example, I am using it to highlight that it is becoming tricky to pick trades at the moment, very tricky. We are still trapped between 9750 and 10100.
Bears
We are at the bottom of the range that I mentioned above and threatening to take it out. We have broken out of the bullish trend channel to the downside, we are below the daily 200 EMA and if we break 9750 we have a good couple of hundred points to the downside to complete the extension of the current move down.
Bulls
Stock markets generally tend to inflate and more often than not, tend to go up. Price is moving sideways at the moment and holding up on the kumo cloud. We are at the bottom of the range and that will allow a decent swing trade opportunity to go long with relatively small risk. Its unlikely that the fed are going to hike rates in June, it’s likely that UK will remain in the EU so the fundamental outlook is a little better than the technicals at the moment.
Dax Support & Resistance
| KEY LEVELS | |
| Daily R2 | 10001 |
| Daily R1 | 9913 |
| Daily Pivot | 9841 |
| Daily S1 | 9753 |
| Daily S2 | 9681 |
| 200 Day EMA | 10146 |
Dax Charts

01 Daily Dax Chart

02 4-Hour Dax Chart

03 1-Hour Dax Chart

03 1-Hour Dax Chart
05 m5 Dax Chart


