Good morning traders!
A very slow day yesterday on the Dax with very little to commentate on as trading was contained within a 59 point trading range. The market gained 0.07% on the day and price still sits above the 12400 level that was such significant resistance until only a day or two ago.
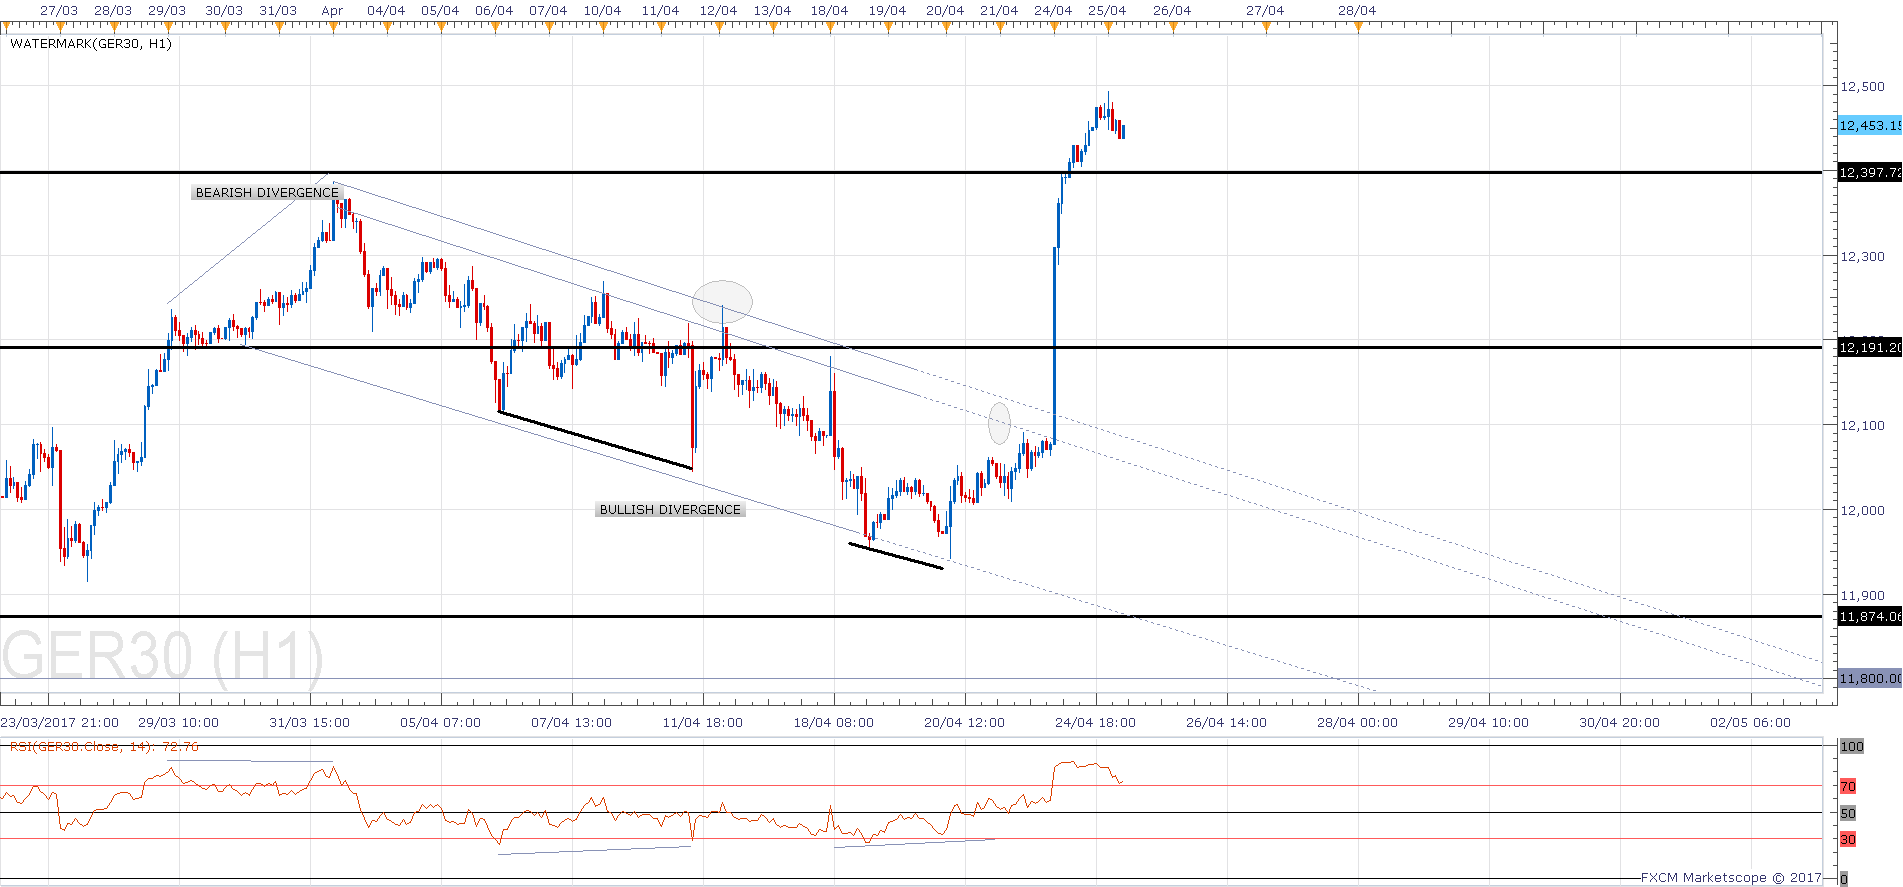
On the daily chart, looking at the RSI, we are still below 70, suggesting that we can still see higher prices before being considered as overbought. We are above the Kumo cloud, above the 200 EMA, above previous resistance, clearly in a bullish technical trend. Keep an eye out for bearish divergence (higher highs for the price, lower highs for the oscillator) for clues that we may be ready for a reversal.
On the hourly chart, we are still massively extended, bears are certainly hoping for, at the very least, a retracement from current levels and I am watching for the bearish divergence clue here as well. The oscillator has started to return to less extended levels, but price remains stretched, so the pattern would trigger an alert if we see higher prices but the oscillator finds a lower peak.
Due to the [relatively] subdued day yesterday, the pivot levels are much more compressed than normal (pivot point indicator), so I will take those with a ‘pinch of salt’. Price is sat in the top quarter of the Bollinger band, although just around the 1.0 standard deviation and this will be close to the daily pivot today.
Yesterday I mentioned that we were likely to see sideways trading, today keep an eye out for any French election updates, but perhaps don’t expect fireworks. The levels I mentioned yesterday are still valid
Dax Support & Resistance
| KEY LEVELS | |
| Open | 12466 |
| High | 12496 |
| Low | 12437 |
| Close | 12475 |
| Range | 59 |
| Change | 0.07% |
| 14 Day ATR | 130.24 |
| Daily R2 | 12525 |
| Daily R1 | 12498 |
| Daily Pivot | 12467 |
| Daily S1 | 12440 |
| Daily S2 | 12409 |
| 200 Day EMA | 11313 |


