Good morning traders!
I suspect there could be some low volume in the market today because the UK have a bank holiday and there will be less traders around. But gives us a chance to look at the markets and get a feel for where we’re heading.
Targets to the downside: 10390, a break lower could open up a move towards 10094. Most likely outcome is that 10390 will hold and bulls will buy from the pullback zone highlighted on the daily chart.
Dax Outlook: We are stuck in a range and waiting to reach the pullback zone for bulls to step back in.
Dax Support & Resistance
| KEY LEVELS | |
| Daily R2 | 10692 |
| Daily R1 | 10608 |
| Daily Pivot | 10531 |
| Daily S1 | 10447 |
| Daily S2 | 10369 |
| 200 Day EMA | 10156 |
Dax Daily Chart
We are above the daily 200 EMA and still above the various horizontal levels that were previously seen as resistance. There is currently a support zone between 10320 – 10500. There have been two or three days recently where price has attempted to break into that support zone, but been rejected. We may very well attempt to do the same today, although 10500 is currently holding up so far.
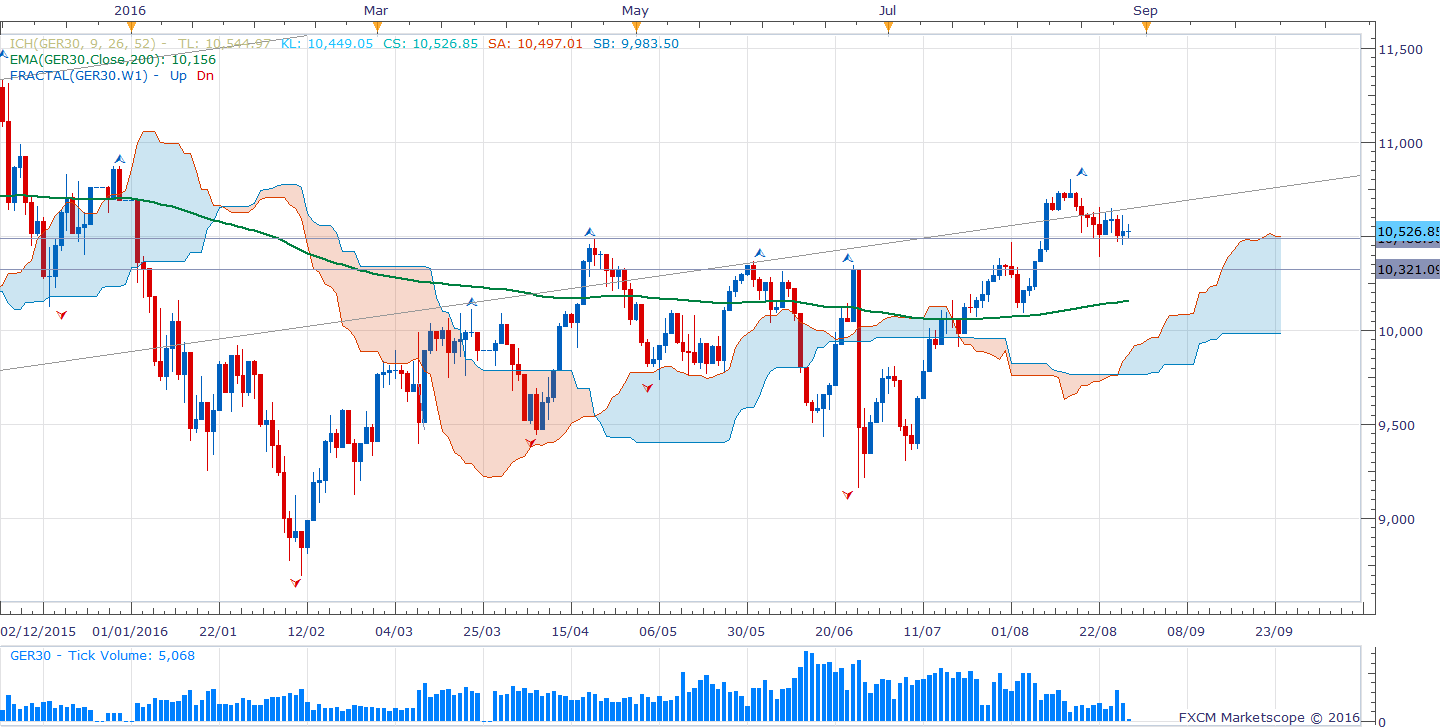
01 Dax Daily Chart
Dax 4-Hour Chart
Have we now created our higher low to continue this bullish trend? 10450 has been tested a couple of times recently but we have struggled to progress from here and take out 10650. So we have a range that we are trapped inside and looking at the open and closes on the most recent 5-7 candles, that range is getting more and more compressed. I expect a breakout soon.

02 Dax H4 Chart
Dax 1 Hour Chart
This 1-hour chart has a custom Heiken Ashi smoothed indicator applied with a simple notification telling me when the ‘trend’ has changed. Right now it’s signalling a change from bullish to bearish. So this could suggest that traders may have more success looking for opportunities to go short.
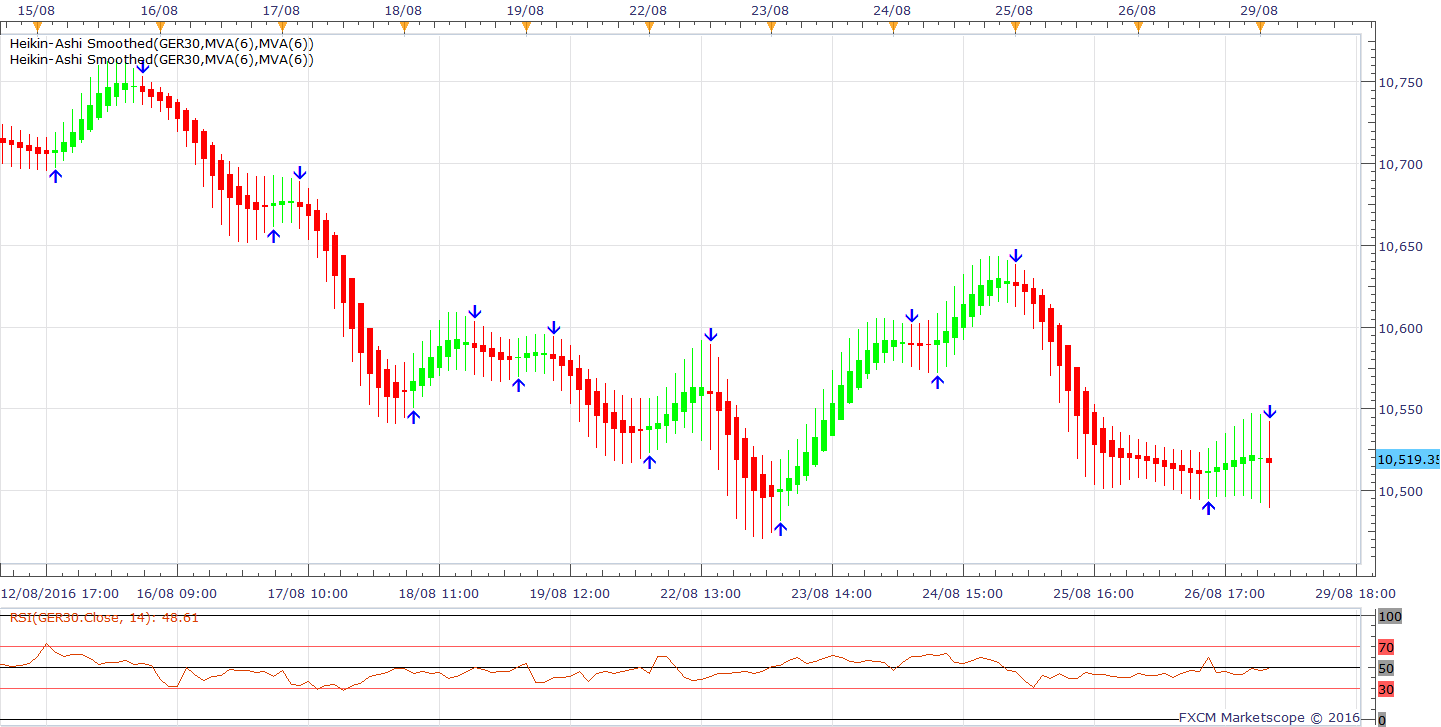
03 H1 Dax Chart
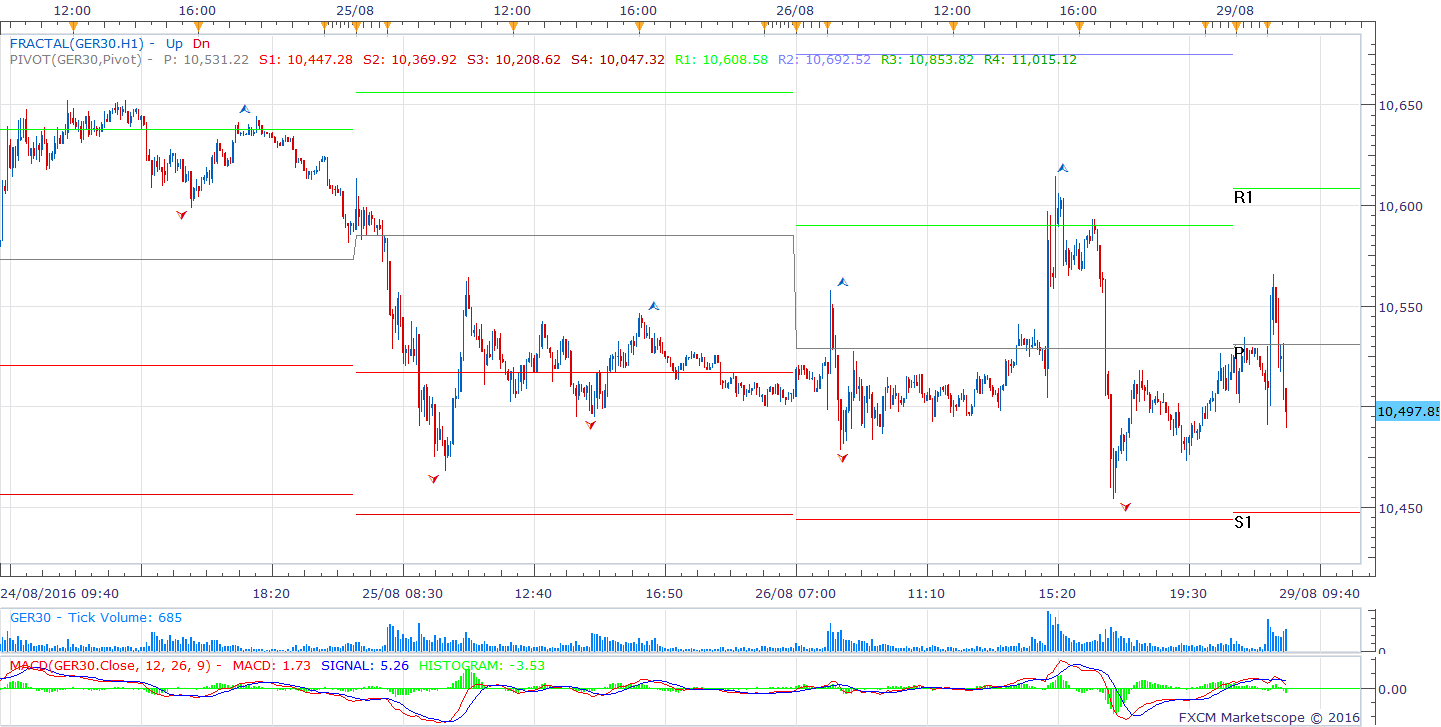
Dax 30-Minute Chart
Not much going on here, the only interesting point to comment on is that the weekly pivot point indicator has used the trading range as the R1 and S1. We need to see a breakout.

04 Dax m30 Chart
Dax 5-Minute Chart
Sideways!
05 Dax m5 Chart


