No Webinar today guys, back on Monday as normal. Thank you for joining us last night on the ATAS order flow webinar. If you missed it, then shame on you! The webinar was recorded, so you can catch it once I upload it over the weekend.
So it’s the last day of the month, it’s also a Friday, it’s also Summer, it’s also a strong selling week. So if Friday is ‘reversal’ day, can we expect a pullback this afternoon? Possibly. We are approaching some major support levels, so it helps a bull to know that. We have plenty of low volume pockets above us. A break above those levels can open up a move higher. Let’s take a look at the charts.
I found the H2 chart test of underside trend line and the m5 Bollinger band reentry, some of the most interesting setups. But let’s take a look at the charts.
DAX Daily Chart
- A strong break below the ascending triangle support, with follow through.
- Testing the 12400 major support (horizontal)
- Currently inside the Kump cloud
- Be aware of Bear traps

01 Daily Chart – Dax Technical Analysis
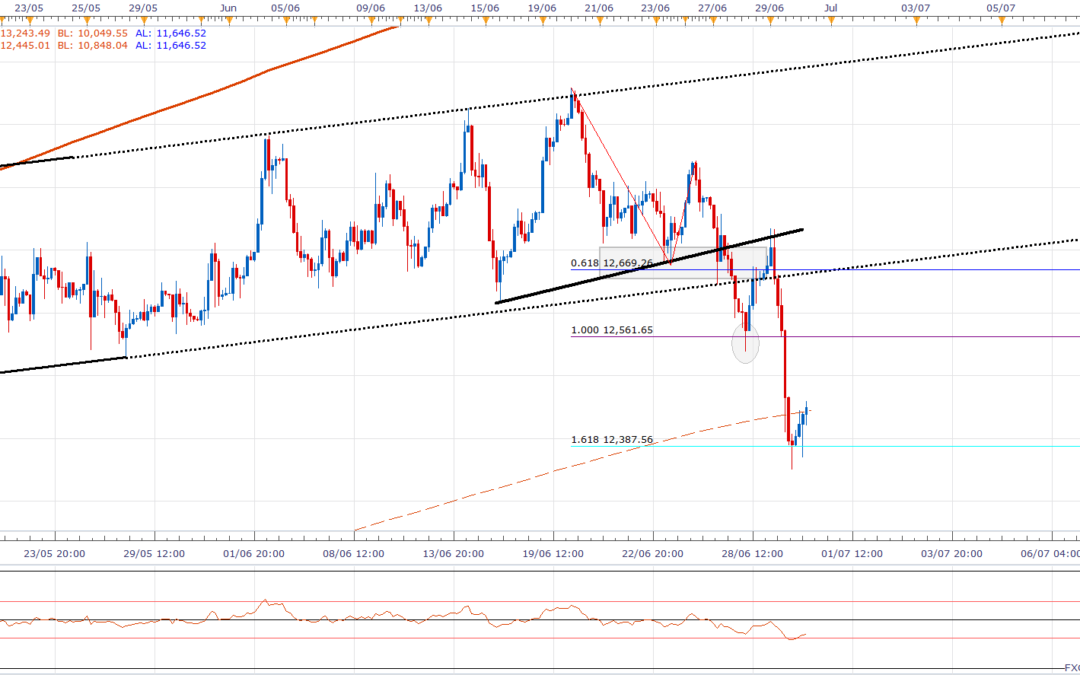
DAX 2 Hour Chart
- A strong break below the Bull channel, reaching the 100% extension
- The retracement tags the underside of the trend line and sells off aggressively
- There are signs of a reprieve at 12400 major support.
- Potential opportunity to go long

02 2 Hourly Chart – Dax Technical Analysis
DAX 5-minute chart
- More bullish divergence below the Bollinger band
- Price breaks back inside the Bollinger band
- The first target is 12500, the second target is 12600
- The daily pivot may provide resistance

03 5m Chart – Dax Technical Analysis
Dax Market Profile
- Low volume pockets between 12475 – 12550 on futures
- The delta is rising with strength. We have seen price increase, but delta stay flat
- The point of control (POC) for yesterday is 12600

04 DAX Market Profile


