Good morning traders!
Find the dip!
The Dax continues the retracement from the recent wave higher and is currently carving out a bull flag. At the time of writing we have just broken down to 11730, so the setup I posted last week still seems to be active, however, we have a couple of potential support zones coming up. We have the 11,723 support from the previous rally, we have the 50% retracement level (23rd – 26th levels) at 11,700 and we have the old range levels from before 11,680 and 11,630. My tradingview setup, that I posted last week, was targeting the 11,630 level, however, I think it’s a bit ambitious.
I am still personally bullish, on a fundamental level, simply because bonds and cash are unattractive to investors at the moment, we are still in a period of easy monetary policy, we have low-interest rates, a crazy corporate super maniac in control of the US economy who is promising further fiscal stimulus and a lagging German stock market that is yet to go ahead and achieve its all-time high this year, despite the mDax continuing to post high after high. On top of that, the market has had plenty of ‘interesting’ news to digest lately: Italian banking crisis, Brexit, US election, terrorism, but it has shaken most of that off and the first half of 2017 has some strong momentum. I am not saying that the trajectory will remain the same, but the Dax is no stranger to rallying when it’s overbought, so although this is only my opinion, I am bullish.
Volume is still fairly low at the moment which makes the calling of a bottom, quite tricky, but intra-day we are already below the daily S2 and on the hourly chart we have created a much lower low on the oscillator (RSI) but a much higher low on price. I believe this is hidden bullish divergence. I am more interested in the 11650-11700 level if we can get there.
The economic calendar is pretty light today, in terms of high impact news, however, tomorrow could be a lot more volatile. Check the economic calendar here.
Dax Support & Resistance
| KEY LEVELS | |
| Daily R2 | 11874 |
| Daily R1 | 11842 |
| Daily Pivot | 11821 |
| Daily S1 | 11789 |
| Daily S2 | 11773 |
| 200 Day EMA | 10729 |
Dax Charts
The daily chart ‘evening star’ setup that I discussed last week, did not look quite as compelling after Friday’s price action, but the bearish activity continues which now confirms the mini-retracement. Watch for a test of the previous range resistance to act as support.
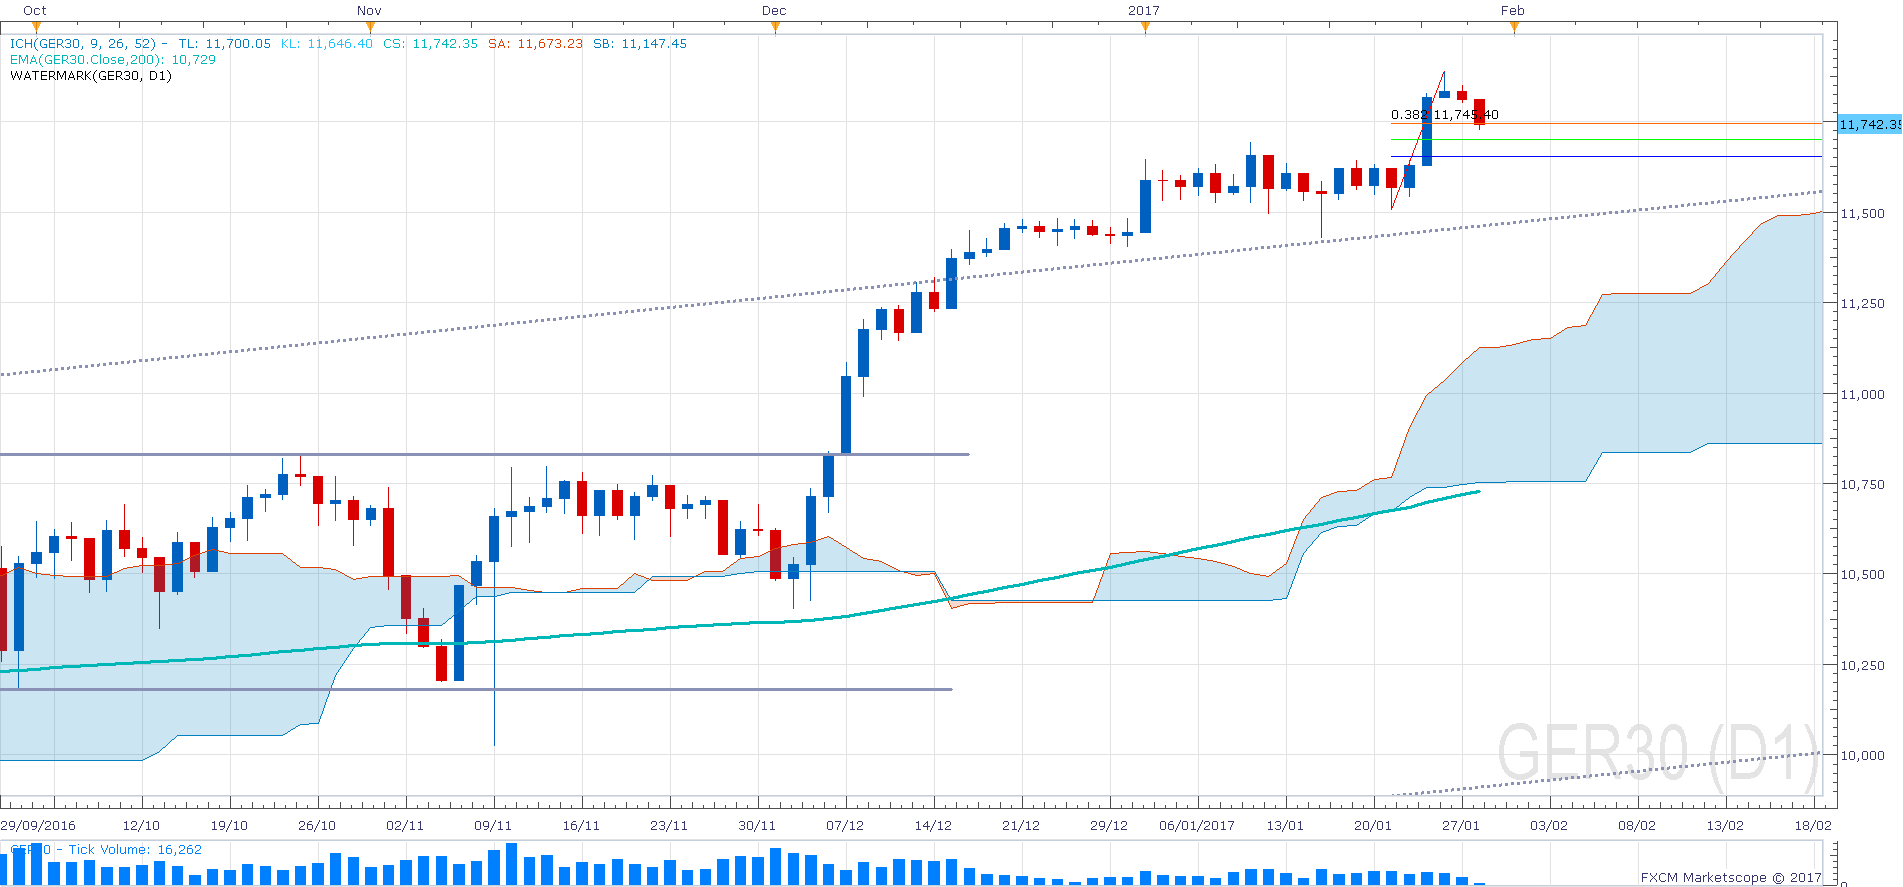
01 Dax Daily Chart
The H1 chart shows the retracement levels that many bullish traders will be targeting to go long and I suspect it will also be a common target for intra-day trading bears to collect some profits.

03 H1 Dax Chart
This was the Tradingview setup that I posted last week and it is doing quite well so far +106 points at the time of writing.

04 Dax m15 Chart
On the 5m chart we are already below the daily S2, half way towards the S3 and we have crossed below the 50-hour EMA. I still remain bullish and perhaps later we find an entry to go long.

05 Dax m5 Chart


