Hello traders!
It’s Friday and it’s the end of the month. I hope you have all done well on your trading.
On the daily chart price is testing the daily 200 EMA, Which may well act as a level of support. At the time of writing the daily candle looks like a pin bar and if we close like that, the Monday may be an interesting opportunity to go long
One the four-hour chart we made a new low of 10183 and this has pierced the previous low on the four-hour chart which was set September 16. This has continued the down trend which began August 12. If price has reached a bottom temporarily now, then I would like to see people back to wards 10420.
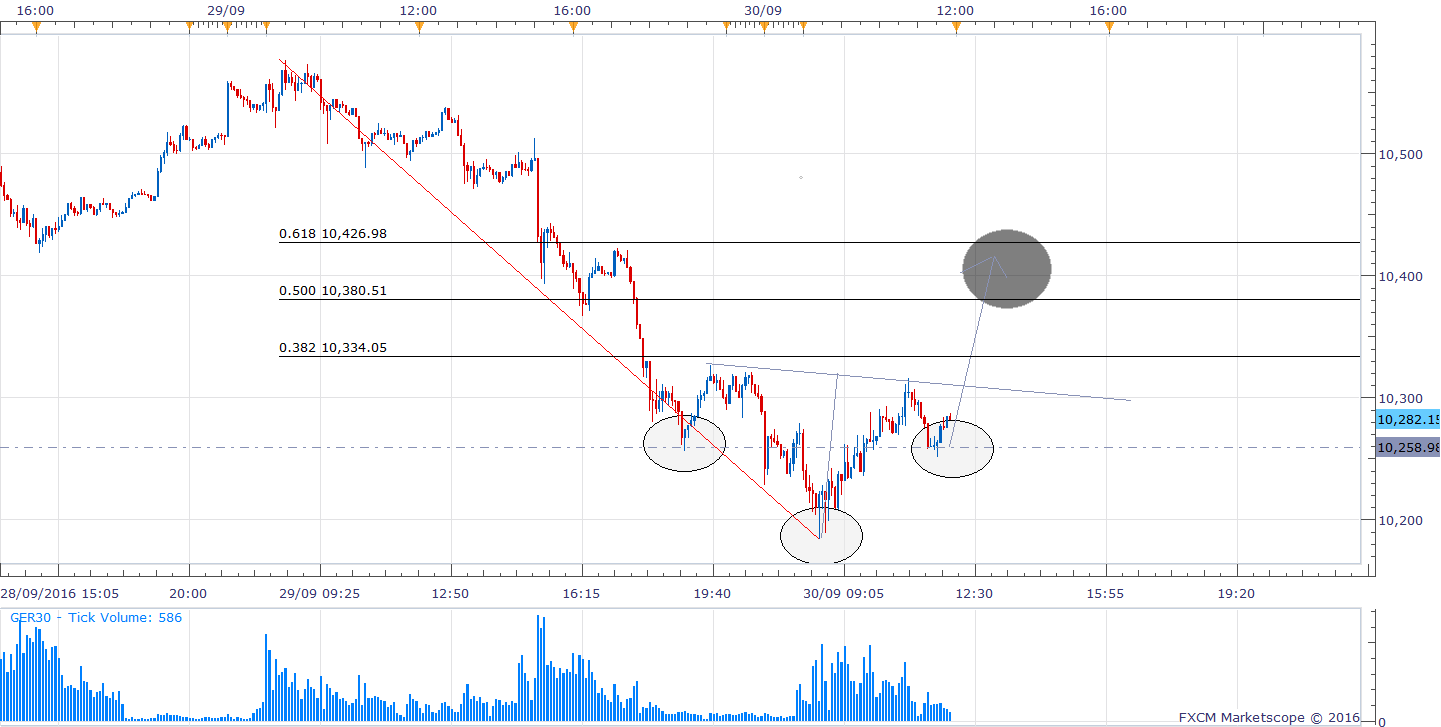
On the five minute chart, there is bullish divergence suggesting that The pullback has started. The daily pivot is an interesting target. There is also an inverse head and shoulders pattern emerging, which again, would provide an interesting opportunity for bulls. Target for a break is around 10415. It all depends on the formation and reaction of the right shoulder.
On the 30 minute chart, if you draw a Fibonacci retracement then a pullback zone would be between 10,380 and 10,427. This zone could interest bears once more.
Dax Support & Resistance
| KEY LEVELS | |
| Daily R2 | 10698 |
| Daily R1 | 10494 |
| Daily Pivot | 10375 |
| Daily S1 | 10171 |
| Daily S2 | 10053 |
| 200 Day EMA | 10233 |
Dax Charts

02-dax-h4-chart

04-dax-m30-chart
05-dax-m5-chart

01-dax-daily-chart


