Hello traders!
Oil rallying 10% was one of the main stories to come out yesterday as OPEC agreed to cut production by 1.2 million bpd, which will likely cascade and have a knock on effect in the markets. Italy are still on the fundamental agenda, with political uncertainty a common area of concern for the European economy.
DaxTrader Subscribers
This morning I had a great result on the Dax from my automated system. It decided to open two sell orders, one of which I decided to close manually as I thought it was too early to have two:
Dax Technical Analysis
On the daily chart, we are still towards the top of the large range that we have been in for some time, the second half of November has been very challenging as the price has been moving sideways. Yesterday’s daily candle looks interesting and appears to be a bearish rejection candle. This projection seems to have happened around about 50% of the Marabuzo candle from Monday. So I think this could be bearish for today.
Yesterday we touched the Bollinger band low on the four-hour chart around 10 540 and then retraced back up to the median line around 10 700, Price now seems to have turned round and I’m testing the love yesterday currently hovering around 10 600. Traders are targeting 10 500 and there could be demand here to go long.
On the one hour chart we attempted to break the support this morning but were rejected and the hourly candle from this morning has a very large tail. Buyers could interpret this as a good opportunity to go long at the bottom of the range. Sellers could interpret this as a second test of support in quick succession, with a break now appearing inevitable.
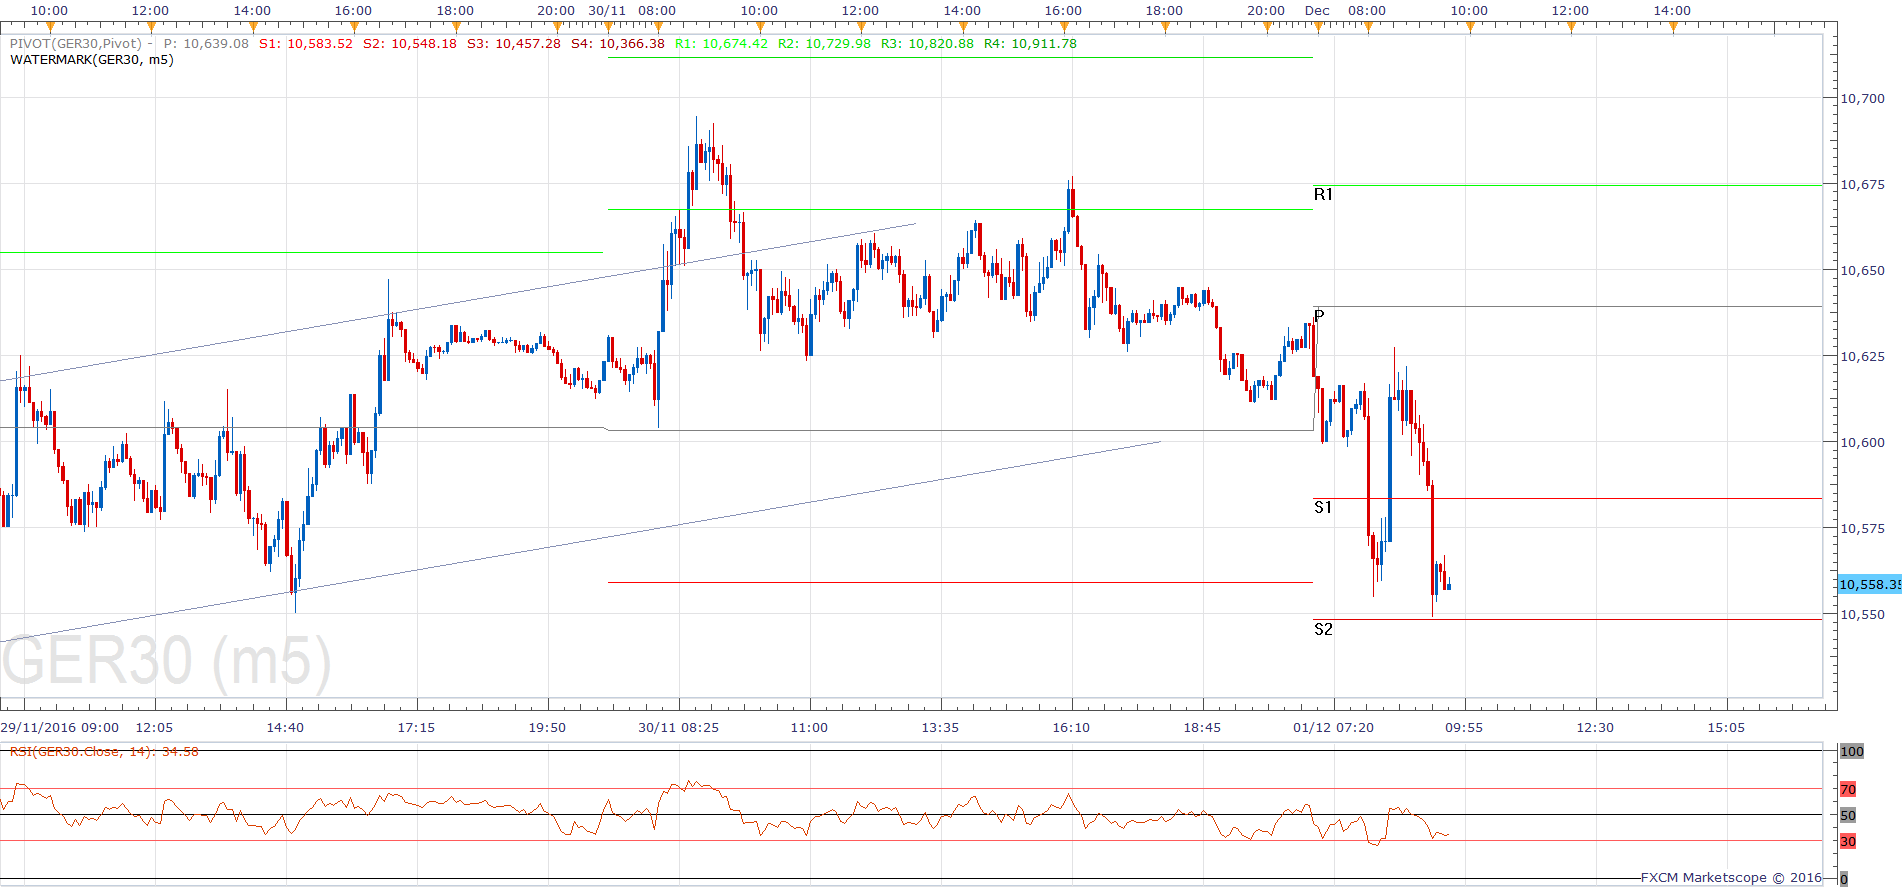
On the five minute chart, you can see a clear break of the bullish trend channel that lasted around two days, which signals a break to the downside. That was an aggressive move this morning which nearly reached the daily S2, before bouncing back up towards the daily pivot, but seemingly continuing its move now.
Dax Support & Resistance
| KEY LEVELS | |
| Daily R2 | 10729 |
| Daily R1 | 10674 |
| Daily Pivot | 10639 |
| Daily S1 | 10583 |
| Daily S2 | 10548 |
| 200 Day EMA | 10367 |
Dax Charts
05-dax-m5-chart

01-dax-daily-chart

02-dax-h4-chart

03-h1-dax-chart


