Hello traders!
I wonder what the results would be of a poll, right now, if we asked the question of who is going to the win the US presidential election. I am sure many traders and also the general public are sick to the back teeth of hearing about it, but I am going to throw out another poll on Twitter. What’s your opinion. Mine is Clinton.
Very simple – who is going to win it: Trump or Clinton? #Trump2016 #Clinton #USElections2016
— DaxTrader.co.uk (@DAXTrader54) November 2, 2016
Yesterday the DaxTrader premium subscribers were treated to a couple of decent sell signals:
DAYTRADE SELLLIMIT #GER30 @ 10686.85 | SL:10741.85 | TP:10592.23 | 2016.11.01 08:44 (GMT) | ID 58552055 (this was an automated algorithm trade)
DAYTRADE SELL #GER30 @ 10687.05 | SL:10705.00 | TP:10610.00 | 2016.11.01 10:45 (GMT) | ID 58554322 (this was a manual trade)
I have had a couple of conversations with subscribers this morning who are actually still short, even now. So congratulations guys, great start to the month.
My thinking is still that we are bearish below 10830 from the daily chart candle formation that i have been discussing for the last week or so. But we have dropped over 300 points fairly quickly, so I am looking for some kind of relief rally to allow price to settle before the next move lower.
The one pattern that caught my eye straight away, wait for it, it’s my favourite term, is the bullish divergence on the 5m chart. We have pressed in to the 10465 level which has been a key level recently especially as we have been ranging for much of October above it. To see price react at this level alongside a divergence signal would be a good opportunity for me to close my short position and wait for another entry higher up.
If we do see a relief rally then we have a gap to close, from the open this morning, which will take us to around 10500, beyond this we could see a move back towards the daily pivot (pivot point indicator) at 10565. The recent Gold rally has support the decline in equity futures, but with price approaching $1300, a significant level, I wonder how it reacts. The SPX has reached 2100 another significant level, I wonder how that reacts. So these questions are also fueling my relief rally speculation.
Of course, if it’s not ready to turn around and instead we continue the bearish momentum, then the obvious targets would be 10400 and 10350 and beyond that 10265, these are all pretty significant levels for the Dax.
So 5m bullish divergence on the Dax, S2 on the weekly pivot point indicator, lower band touch on the H4 moving average envelope and all of this happening after a decent bearish run. If you’re not already short, it’s probably too late. Maybe wait for jumping in, but it’s your money.
Dax Support & Resistance
| KEY LEVELS | |
| Daily R2 | 10852 |
| Daily R1 | 10674 |
| Daily Pivot | 10565 |
| Daily S1 | 10387 |
| Daily S2 | 10278 |
| 200 Day EMA | 10309 |
Dax Charts

01-dax-daily-chart

02-dax-h4-chart

03-h1-dax-chart
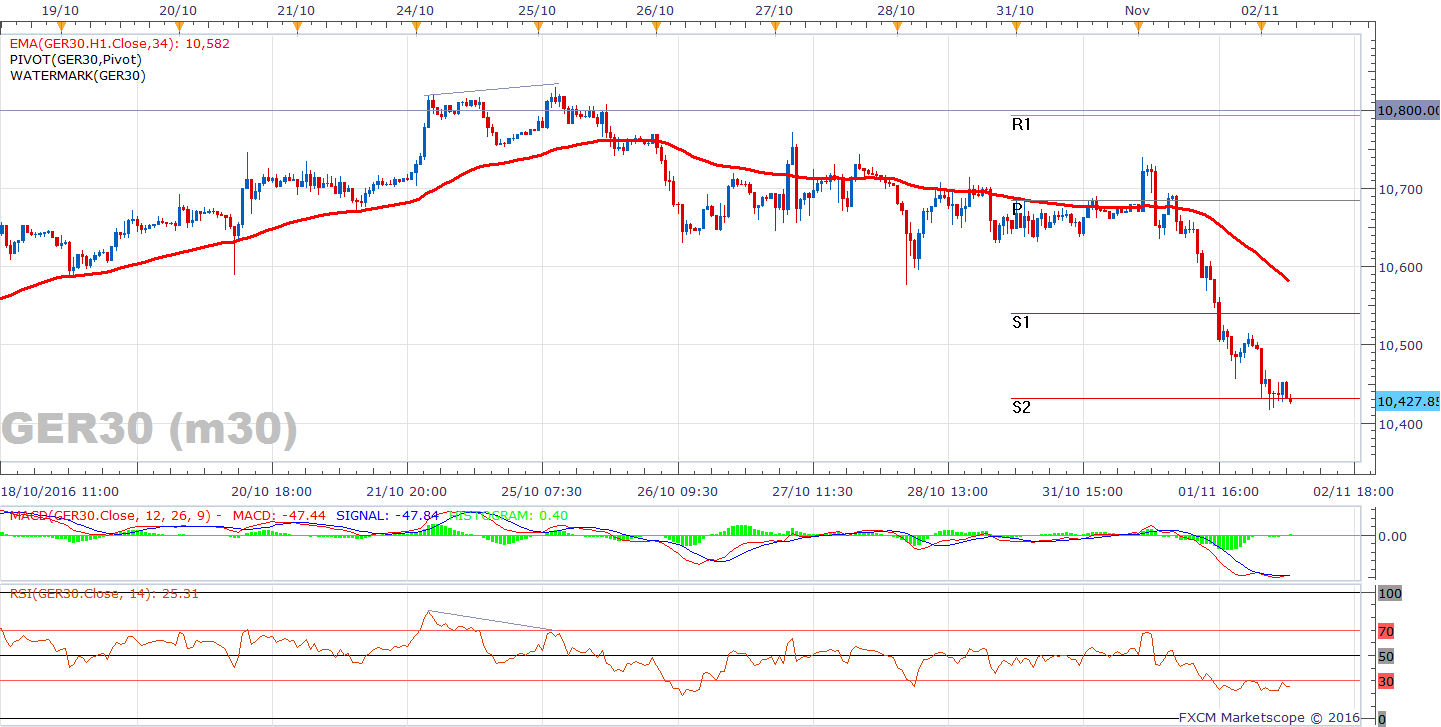
04-dax-m30-chart

05-dax-m5-chart


